Can We Blame Low Labor Participation on Past High Unemployment?

Fifth post in a series. Posts onetwothree and four.

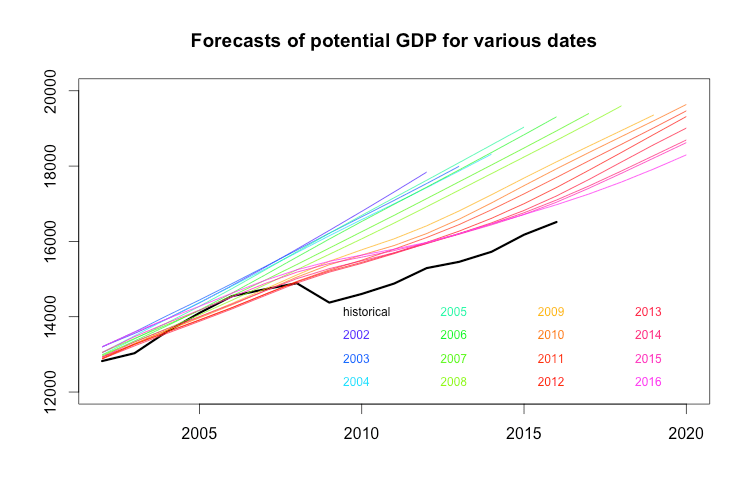
We know that US GDP fell sharply in 2008-2009. We know that none of that decline has been made up by faster growth since the recession: GDP today is about 14 percent below the pre-2008 trend, a gap that shows no sign of closing. We also know that one-third of that shortfall is accounted for by slower productivity growth, and the remaining two-thirds by slower employment growth.

To put numbers on it: Over the past decade, US employment rose by a total of 6 percent, or about 0.5 percent per year. This is about half the rate of employment growth over the last ten years before the recession, and less a quarter the average rate for the postwar period as a whole. 2000-2010 was the first decade since the Depression in which US employment actually fell. Since the unemployment rate today is very close to that of ten years ago, this whole slowdown is accounted for by a decline in laborforce participation.

Employment growth, unlike productivity growth, was already slowing prior to the recession, and  pre-recession forecasts predicted a further slowdown comparable to what actually occurred. This is consistent with a widely-held view that the slowdown in employment is the result of demographic and other structural factors, not of the recession or demand weakness in general. In the next couple posts, I want to take a critical look at this claim. How confident should we be that employment would be the same today in a counterfactual world where the 2008-2009 didn’t happen? How responsive might employment be to stronger demand going forward? And more broadly, how much do changes in laborforce participation seem to be explained by more or less exogenous factors like demographics, and how much by demand and labor-market conditions?

The rest of this post is about an approach to this question that did not produce the results I was hoping for. So I probably won’t include this material in whatever paper comes out of these posts. But as we feel our way into reality it’s important to note down the dead ends as well as the routes that seem promising. And even though this exercise didn’t help much in answering the big questions posed in the previous paragraph, it’s still interesting in its own right.

*

Can the fall in laborforce participation be explained as a direct, predictable effect of the rise in unemployment during the recession? It seems like maybe it can. The starting point is the observation that unemployed workers are much more likely to drop out of the laborforce than people with jobs are. You can see this clearly in the BLS tables on employment transitions. As the figure below shows, about 3 percent of employed people exit the laborforce each month, a fraction that has been remarkably stable since the data begins in 1990. Meanwhile, about 20 percent of unemployed people drop out of the laborforce each month.

transitions1

On the face of it, this 17-point difference suggests an important role for the unemployment rate in changes in labor force participation. All else equal, each year-point of additional unemployment should reduce the labor-force participation rate by two points. (0.17 x 12 = 2.) So you would think that much of the recent fall in laborforce participation could be explained simply by the rise in unemployment during the recession.

When I thought of this it seemed very logical. It would be easy to do a counterfactual exercise, I thought, showing how laborforce participation would have evolved simply based on the historical transition rates between employment, unemployment and out of the laborforce, and the actual evolution of employment and unemployment. If you could show that something like the actual fall in laborforce participation was a predictable result of the rise in unemployment during the recession, that would support the idea that demand rather than “structural” factors are at work. And even if it wasn’t that strong positive evidence, it would suggest skepticism about similar counterfactual exercises using historical participation rates by age and so on.

I mean, it makes sense, right? Unemployed people are much more likely to leave the workforce than employed people, so a rise in unemployment should naturally lead to a decline in laborforce participation. But as the figure below shows, the numbers don’t work.

What I did was start with the populations of employe, unemployed and not-in-the-laborforce people at the end of the recession in December 2009. Then I created a counterfactual scenario for the remaining period using the actual transition rates between employment and unemployment but the pre-recession average rates for transitions between not in the workforce and unemployment and employment. In other words, just knowing the average rates that people move between employment, unemployment and out of the workforce, and the actual shifts between employment and unemployment, what path would you have predicted for laborforce participation over 2010-2016?

transitions2The heavy gray line shows the historical fraction of the population aged 16 and over who are not in the laborforce. The black line shows the results of the counterfactual exercise. Not very close.

There turn out to be two reasons why the counterfactual exercise gives such a poor fit. Both are interesting and neither was obvious before doing the exercise. The first reason is that there are  surprisingly large flows from out of the labor force back into it. Per the BLS, about 7 percent of people who report being out of the labor force in a given month are either employed or unemployed (i.e. actively seeking work) the following month. This implies that the typical duration of being out of the workforce is less than a year — though of course this is a mix of people who leave the workforce for just a month or two and people who leave for good. For present purposes, the important thing is that exogenous changes to the employment-population ratio decline quickly, with a half-life of only about a year. So while the historical data suggests that a rise in unemployment like we saw in 2008-2009 should have been associated with a large rise in the share of the population not in the laborforce, it also suggests that this effect should have been transitory — a couple years after unemployment rates returned to normal, participation rates should have as well. This is not what we’ve seen.

The large gross movements in and out of the laborforce mean that sustained lower participation rates can’t be straightforwardly understood as the “echo” of high unemployment in the past. But they do also tend to undermine the structural story — if the typical stint outside the laborforce lasts less than a year it can hardly be due to something immutable.

The second reason why the counterfactual doesn’t fit the data was even more surprising, at least to me. I constructed my series using the historical average transition rates into and out of the workforce. But transition rates during the recession and early recovery departed from the historical average in an important way: unemployed workers were significantly less likely to exit the workforce. This turns out to be the normal pattern, at least over the previous two business cycles — if you look back to that first figure, you can see dips in the transition rate from unemployed to out of the workforce in the early 1990s and early 2000s downturns as well. The relationship is clearer in the next figure, a scatter of the unemployment rate and the share of unemployed workers leaving the workforce each month.

transitions3


As you can see, there is a strong negative relationship — when unemployment was around 4 percent in 1999-2000 and again in 2006-2007, about a quarter of the unemployed exited the laborforce each month. But at the peak of the past recession when unemployment reached 10 percent, only 18 percent of the unemployed left the laborforce each month. That might not seem like a huge difference, but it’s enough to produce quite different dynamics. It’s also a bit surprising, since you would think that people would be more likely to give up searching for work when unemployment is high than when when it is low. The obvious explanation would be that the people who are out of work when the unemployment rate is low are not simply a smaller set of the same people who are out of work when the rate is high, but are different in some way. The same factors that keep them at the back of the hiring queue may make also be likely to push them out of the laborforce altogether. Extended unemployment insurance might also play a role.

It would be possible to explore this further using CPS data, which is the source for the BLS tables I’m working with. No doubt there are papers out there describing the different characteristics of the unemployed in periods of high versus low unemployment. (Not being a labor economist, I don’t know this literature.) But I am going to leave it here.

Summary: The fact that unemployed people are much more likely to leave the laborforce than employed people are, suggests that some part of the fall in laborforce particiaption since 2008 might be explained by the lingering effects of high unemployment in the recession and early recovery. But this story turns out not tow work, for two reasons. First, the rapid turnover of the not in the laborforce population means that this direct effect of high unemployment on participation is fairly shortlived. Second, the rate at which unemployed people exit the laborforce turns out to be lower when unemployment is high. Together, these two factors produce the results shown in the second figure — the fall in participation you would predict based simply on high unemployment is steeper but shorter-lived than what actually occurred. The first factor — the large flows in and out of the laborforce — while it vitiates the simple story I proposed here, is consistent with a broader focus on demand rather than demographics as an explanation for slow employment growth. If people are frequently moving in and out of the laborforce, it’s likely that their decisions are influenced by their employment prospects, and it means they’re not determined by fixed characteristics like age. The second factor — that unemployed people were less likely to give up looking for jobs during 2009-2011, as in previous periods of high unemployment — is, to me, more surprising, and harder to fit into a demand-side story.

Employment, Productivity and the Business Cycle

Fourth post in a series. Posts one, two and three.

Empirically-oriented macroeconomists have recognized since the early 20th century that output, employment and productivity move together over the business cycle. The fact that productivity falls during recessions means that employment varies less over the cycle than output does. This behavior is quite stable over time, giving rise to Okun’s law. In the US, Okun’s law says that the unemployment rate will rise by one point in each 2.5 point shortfall of GDP growth over trend — a ratio that doesn’t seem to have declined much since Arthur Okun first described it in the mid-1960s. [1]

It’s not obvious that potential should show this procyclical behavior. As I noted in the previous post, a naive prediction from a production function framework would be that a negative demand shock should reduce employment more than output, since business can lay off workers immediately but can’t reduce their capital stock right away. In other words, productivity should rise in recessions, since the labor of each still-employed worker is being combined with more capital.

There are various explanations for why labor productivity behaves procyclically instead. The most common focus on the transition costs of changing employment. Since hiring and firing is costly for businesses, they don’t adjust their laborforce to every change in demand. So when sales fall in recessions, they will keep extra workers on payroll — paying them now is cheaper than hiring them back later. Similarly, when sales rise businesses will initially try to get more work out of their existing employees. This shows up as rising labor productivity, and as the repeated phenomenon of “jobless recoveries.”

Understood in these terms, the positive relationship between output, employment and productivity should be a strictly short-term phenomenon. If a change in demand (or in other constraints on output) is sustained, we’d expect labor to fully adjust to the new level of production sooner or later. So over horizons of more than a year or two, we’d expect output and employment to change in proportion. If there are other limits on production (such as non-produced inputs like land) we’d expect output and labor productivity to move inversely, with faster productivity growth associated with slower employment growth or vice versa. (This is the logic of “robots taking the jobs.”) A short-term positive, medium term negative, long-term flat or negative relationship between employment growth and productivity growth is one of the main predictions that comes out of a production function. But it doesn’t require one. You can get there lots of other ways too.

And in fact, it is what we see.

prod-emp correl

The figure shows the simple correlation of employment growth and productivity growth over various periods, from one quarter out to 50 quarters. (This is based on postwar US data.) As you can see, over periods of a year or less, the correlation is (weakly) positive. Six-month periods in which employment growth was unusually weak are somewhat more likely to have seen weak productivity growth as well. This is the cyclical effect presumably due to transition costs — employers don’t always hire or fire in response to short-run changes in demand, allowing productivity to vary instead. But if sales remain high or low for an extended period, employers will eventually bring their laborforce into line, eliminating this relationship. And over longer periods, autonomous variation in productivity and labor supply are more important. Both of these tend to produce a negative relationship between employment and productivity. And that’s exactly what we see — a ten-year period in which productivity grew unusually quickly is likely to be one in which employment grew slowly. (Admittedly postwar US data doesn’t give you that many ten-year periods to look at.)

Another way of doing this is to plot an “Okun coefficient” for each horizon. Here we are looking at the relationship between changes in employment and output. Okun’s law is usually expressed in terms of the relatiojship between unemployment and output, but here we will look at it in terms of employment instead. We write

(1)    %ΔE = a (g – c)

where %ΔE is the percentage change in employment, g is the percentage growth in GDP, is a constant (the long-run average rate of productivity growth) and a is the Okun coefficient. The value of a says how much additional growth in employment we’d expect from a one percentage-point increase in GDP growth over the given period. When the equation is estimated in terms of unemployment and the period is one, year, a is generally on the order of 0.4 or so, meaning that to reduce unemployment by one point over a year normally requires GDP growth around 2.5 points above trend. We’d expect the coefficient for employment to be greater, but over short periods at least it should still be less than one.

Here is what we see if the estimate the equation for changes in output and employment for various periods, again ranging from one quarter up to ten years. (Again, postwar US data. The circles are the point estimates of the coefficients; the dotted lines are two standard errors above and below, corresponding to a standard 95% confidence interval.)

emp on output

What’s this show? If we estimate Equation (1) looking at changes over one quarter, we find that one percentage point of additional GDP growth is associated with just half a point of additional employment growth. But if we estimate the same equation looking at changes over two years, we find that one point of additional GDP growth is associated with 0.75 points of additional employment growth.

The fact that the coefficient is smallest for the shorter periods is, again, consistent witht he conventional understanding of Okun’s law. Because hiring and firing is costly, employers don’t fully adjust staffing unless a change in sales is sustained for a while. If you were thinking in terms of a production function, the peak around 2 years represents a “medium-term” position where labor has adjusted to a change in demand but the capital stock has not.

While it’s not really relevant for current purposes, it’s interesting that at every horizon the coefficient is significantly below zero. What this tells us is that there is no actual time interval corresponding to the “long run” of the model– a period long enough for labor and the capital stock to be fully adjusted but short enough that technology is fixed. Over this hypothetical long run, the coefficient would be one. One way to think about the fact that the estimated coefficients are always smaller, is that any period long enough for labor to adjust, is already long enough to see noticeable autonomous changes in productivity. [2]

But what we’re interested in right now is not this normal pattern. We’re interested in how dramatically the post-2008 period has departed from it. The past eight years have seen close to the slowest employment growth of the postwar period and close to the slowest productivity growth. It is normal for employment and productivity to move together for a couple quarters or a year, but very unusual for this joint movement to be sustained over nearly a decade. In the postwar US, at least, periods of slow employment growth are much more often periods of rapid productivity growth, and conversely. Here’s a regression similar to the Okun one, but this time relating productivity growth to employment growth, and using only data through 2008.

prod on empWhile the significance lines can’t be taken literally given that these are overlapping periods, the figure makes clear that between 1947 and 2008, there were very few sustained periods in which both employment and productivity growth made large departures from trend in the same direction.

Put it another way: The past decade has seen exceptionally slow growth in employment — about 5 percent over the full period. If you looked at the US postwar data, you would predict with a fair degree of confidence that a period of such slow employment growth would see above-average productivity growth. But in fact, the past decade has also seen very low productivity growth. The relation between the two variables has been much closer to what we would predict by extrapolating their relationships over periods of a year. In that sense, the current slowdown resembles an extended recession more than it does previous periods of slower growth.

As I suggested in an earlier post, I think this is a bigger analytic problem than it might seem at first glance.

In the conventional story, productivity is supposed to be driven by technology, so a slowdown in productivity growth reflects a decline in innovation and so on. Employment is driven by demographics, so slower employment growth reflects aging and small families. Both of these developments are negative shifts in aggregate supply. So they should be inflationary — if the economy’s productive potential declines then the same growth in demand will instead lead to higher prices. To maintain stable prices in the face of these two negative supply shocks, a central bank would have to raise interest rates in order to reduce aggregate spending to the new, lower level of potential output. Is this what we have seen? No, of course not. We have seen declining inflation even as interest rates are at historically low levels. So even if you explain slower productivity growth by technology and explain slower employment growth by demographics, you still need to postulate some large additional negative shift in demand. This is DeLong and Summers’ “elementary signal identification point.”

Given that we are postulating a large, sustained fall in demand in any case, it would be more parsimonious if the demand shortfall also explained the slowdown in employment and productivity growth. I think there are good reasons to believe this is the case. Those will be the subject of the remaining posts in this series.

In the meantime, let’s pull together the historical evidence on output, employment and productivity growth in one last figure. Here, the horizontal axis is the ten-year percentage change in employment, while the vertical axis is the ten-year percentage change in productivity. The years are final year of the comparison. (In order to include the most recent data, we are comparing first quarters to first quarters.) The color of the text shows average inflation over the ten year period, with yellow highest and blue lowest. The diagonal line corresponds to the average real growth rate of GDP over the full period.

e-p scatter

What we’re looking at here is the percentage change in productivity, employment and prices over every ten-year period from 1947-1957 through 2006-2016. So for instance, growth between 1990 and 2000 is represented by the point labeled “2000.” During this decade, total employment rose by about 20 percent while productivity rose by a total of 15 percent, implying an annual real growth of 3.3 percent, very close to the long-run average.

One natural way to think about this is that yellow points below and to the right of the line suggest negative supply shocks: If the productive capacity of the economy declines for some reason, output growth will slow, and prices will rise as private actors — abetted by a slow-to-react central bank — attempt to increase spending at the usual rate. Similarly, blue points above the line suggest positive supply shocks. Yellow points above the line suggest positive demand shocks — an increase in spending can increase output growth above trend, at least for a while, but will pull up prices as well. And blue points below the line suggest negative demand shocks. This, again, is Delong and Summers’ “elementary signal identification point.”

We immediately see what an outlier the recent period is. Both employment and productivity growth over the past ten years have been drastically slower than over the preceding decade — about 5 percent each, down from about 20 percent. 2000-2010 and 2001-2011 were the only ten-year periods in postwar US history when total employment actually declined. The abruptness of the deceleration on both dimensions is a challenge for views that slower growth is the result of deep structural forces. And the combination of the slowdown in output growth with falling prices — especially given ultra-low interest rats — strongly suggests that we’ve seen a negative shift in desired spending (demand) rather than in the economy’s productive capacities (supply).

Another way of looking at this is as three different regimes. In the middle is what we might call “the main sequence” — here there is steady growth in demand, met by varying mixes of employment and productivity growth. On the upper right is what gets called a “high-pressure economy,” in which low unemployment and strong demand draw more people into employment and facilitates the reallocation of labor and other resources toward more productive activity, but put upward pressure on prices. On the lower left is stagnation, where weak demand discourages participation in the labor force and reduces productivity growth by holding back investment, new business formation and by leaving a larger number of those with jobs underemployed, and persistent slack leads to downward pressure on prices (though so far not outright deflation). In other words, macroeconomically speaking the past decade has been a sort of anti-1960s.


[1] There are actually two versions of Okun’s law, one relating the change in the unemployment rate to GDP growth and one relating the level of unemployment to the deviation of GDP from potential. The two forms will be equivalent if potential grows at a constant rate.

[2] The assumption that variables can be partitioned into “fast” and “slow” ones, so that we can calculate equilibrium values of the former with the latter treated as exogenous, is a very widespread feature of economic modeling, heterodox as much as mainstream. I think it needs to be looked at more critically. One alternative is dynamic models where we focus on the system’s evolution over time rather than equilibrium conditions. This is, I suppose, the kind of “theory” implied by VAR-type forecasting models, but it’s rare to see it developed explicitly. There are people who talk about a system dynamics approach, which seems promising, but I don’t know much about them.

Links for July 27, 2016

Labor dynamism and demand. My colleagues Mike Konczal and Marshall Steinbaum have an important new paper out on  the decline in new business starts and in labor mobility. They argue that the data don’t support a story where declining labor-market dynamism is the result of supply-side factors  like occupational licensing. It looks much  more like the result of chronically weak demand for labor, which for whatever reason is not picked up by the conventional unemployment rate.  This is obviously relevant to the potential output question I’m interested in — a slowdown in the rate at which workers move to new firms is a natural channel by which weak demand could reduce labor productivity. It’s also a very interesting story in its own right.

Konczal and Steinbaum:

The decline of entrepreneurship and “business dynamism” has become an accepted fact … Explanations for these trends … broadly fall on the supply side: that increasingly onerous occupational licensing impedes entry into certain protected professions and restricts licensed workers to staying where they are; that the high cost of housing thanks to restrictions on development hampers individuals from moving… But we find that the data reject these supply-side explanations: If there were increased restrictions on changing jobs or starting a business, we would expect those few workers and entrepreneurs who do manage to move to enjoy increased wage gains relative to periods with higher worker flows, and we would expect aggressive hiring by employers with vacancies. … Instead, we see the opposite…

We propose a different organizing principle: Declining business dynamism and labor mobility are features of a slackening labor market … workers lucky enough to have formal employment stay where they are rather than striking out as entrepreneurs …

Also in Roosevelt news, here’s a flattering piece about us in the New York Times Magazine.


John Kenneth who? Real World Economics Review polled its subscribers on the most important economics books of the past 100 years. Here’s the top ten. Personally I suspect Debt will have more staying power than Capital in the 21st Century, and I think Minsky’s book John Maynard Keynes is a better statement of his vision than Stabilizing an Unstable Economy, a lot of which is focused on banking-sector developments of the 1970s and 1980s that aren’t of much interest today. But overall it’s a pretty good list. The only one I haven’t read is The Affluent Society. I wonder if anyone under the age of 50 picked that one?


Deflating the elephant. Here is a nice catch from David Rosnick. Brank Milanovic has a well-known graph of changes in global income distribution over 1988-2008. What we see is that, while within most countries there has been increased polarization, at the global level the picture is more complicated. Yes, the top of the distribution has gone way up, and the very bottom has gone down. But the big fall has been in the upper-middle of the distribution — between the 80th and 99th percentiles — while most of the lower part has has risen, with the biggest gains coming around the 50th percentile. The decline near the high end is presumably working-class people in rich countries and most people in the former Soviet block —who were still near the top of the global distribution in 1988. A big part of the rise in the lower half is China. A natural question is, how much? — what would the distribution look like without China? Milanovic had suggested that the overall picture is still basically the same. But as Rosnick shows, this isn’t true — if you exclude China, the gains in the lower half are much smaller, and incomes over nearly half the distribution are lower in 2008 than 20 years before. It’s hard to see this as anything but a profoundly negative verdict on the Washington Consensus that has ruled the world over the past generation.

gic_100

By the way, you cannot interpret this — as I at first wrongly did — as meaning that 40 percent of the world’s people have lower incomes than in 1988. It’s less than that. Faster population growth in poor countries would tend to shift the distribution downward even if every individual’s income was rising.


Does nuclear math add up? Over at Crooked Timber, there’s been an interesting comments-thread debate between Will Boisvert (known around here for his vigorous defense of nuclear power) and various nuke antis and skeptics. I’m the farthest thing from an expert, I can’t claim to be any kind of arbiter. But personally my sympathies are with Will. One important thing he brings out, which I hadn’t thought about enough until now, is the difference between electricity and most other commodities. Part of the problem is the very large share of fixed costs — as the Crotty-Minsky-Perelman strain of Keynesians have emphasized, capitalism does badly with long lived capital assets. A more distinctive problem is the time dimension — electricity produced at one time is not a good substitute for electricity produced at a different time, even just an hour before or after. Electricity cannot be stored economically at a meaningful scale, nor — given that almost everything in modern civilization uses it — can its consumption be easily shifted in time.  This means that straightforward comparisons of cost per kilowatt — hard enough to produce, given the predominance of fixed  costs — can be misleading. Regardless of costs, intermittent sources — like wind or solar — have to be balanced by sources that can be turned on anytime — which in the absence of nuclear, means fossil fuels.

Do you believe, as I do, that climate change is the great challenge facing humanity in the next generation? Then this is a very strong argument for nuclear power. Whatever its downsides, they are not as bad as boiling the oceans. Still, it’s not a decisive argument. The big other questions are the costs of power storage and of more extensive transmission networks — since when the sun isn’t shining and the wind isn’t blowing in one place, they probably are somewhere else. (I agree with Will that using the price mechanism to force electricity usage to conform to supply from renewables is definitely the wrong answer.) The CT debate doesn’t answer those questions. But it’s still an example of how informative blog debate can be when there are people  both sides with real expertise who are prepared to engage seriously with each other.


On other blogs, other wonders. Here is a fascinating post by Laura Tanenbaum on the end of sex-segregated job ads and the false dichotomy between “elite” and “grassroots”  feminism.

This very interesting article by Jose Azar on the extent and economic significance of common ownership of corporate shares deserves a post of its own.

Here’s a nice little think piece from Bloomberg wondering what, if anything, is meant by “the natural rate” of interest. I’m glad to see some skepticism about this concept in the larger conversation. In my mind, the “natural rate” is one of the key patches covering over the disconnect between economic theory and the observable economy.

Bhenn Bhiorach has a funny post on the lengths people will go to to claim that low inflation is really high inflation.

CBO Forecasts: What’s Under the Hood?

In this post I want to say something about the methodology behind the CBO’s potential output forecasts. Here’s the tl;dr:

Officially, the CBO forecasts are based on a production function, which requires use of a number of unobservable parameters and questionable assumptions. But with one important exception, use of the the production function has no effect on the final estimate of potential output. The results are always very close to what you would get by simply extrapolating the trend of labor productivity.

The post is based on various CBO documents on their forecasting methodology, mainly this one, this one and this one, and on the relevant sections of the most recent Budget and Economic Outlook. It’s also much too long, mainly negative critique, and basically unnecessary to the larger argument I’m developing. Much of the post is devoted to the neoclassical production function (a serious demerit); since I’m far from an expert on it, there’s a nontrivial chance of embarrassing mistakes. You can keep reading or not.

Continue reading CBO Forecasts: What’s Under the Hood?

Links for July 20, 2016

The responsibilities of heterodoxy. Arjun Jayadev and I have an ongoing project of interviewing dissenting economists who we think deserve wider recognition. Our first interview was with Axel Leijonhufvud; the second, just now up at the INET site, is with our old professor Jim Crotty. Jim’s ECO 710 was for us, as for hundreds of UMass grad students over the past 30 years, the starting point for systematically thinking about the economy as a whole. (You could think of him as sort of the Earth-II version of Rudi Dornbusch.) You can read more of my thoughts about him at the link.

Here’s an interesting clip that didn’t make it into the INET version:

The radicalism — and coherence — of Keynes larger political-economic program is a topic I’d like to return to in the future, as is the importance of an organic relationship to some broader social movement or political project. For heterodox economists, I think even more than for other academics, it’s impossible to even do good scholarship if your relationship to your object of study is only as a scholar. Science, as Max Weber says, “presupposes that what is yielded by scientific work is important in the sense that it is ‘worth being known.’ … This presupposition cannot be proved by scientific means.”


The problem with heterodoxy. The post here about the non-existence of mainstream economics is now up at Evonomics, in a somewhat improved form. While we’re on that topic, I will let loose with a peeve. Joan Robinson is like a god to me — in an anthropological sense she might even literally be a divinity for my tribe. But I hate that often-quoted line that the only reason to study economics is “to avoid being fooled by economists.” It reinforces the worst habit of heterodox people: putting negative critique above positive efforts to understand the world.


Articles to read. Three recent articles that really deserve posts of their own:

Thomas Palley on negative interest rates (he’s against them).

Jerry Epstein on the costs of big finance.

Cédric Durand and Maxime Gueuder on the weakening link between profits and corporate investment. I’ve been planning to write something on exactly this; clearly it will have to respond to this paper.


Interest rates and trade imbalances. Izabella Kaminska has a very interesting post up at FT Alphaville. (Does she write any other kind?) This one brings out two important points. First, to the extent that low interest rates mainly lead to bringing forward future spending — this is  probably especially true in housing — they are good tools for dealing with temporary downturns but not for secular shortfalls. (Kaminska doesn’t say so, but this is one reason the “natural rate” concept is misleading.) Second, the macroeconomic significance of trade imbalances depends on what happens to the corresponding financial flows — and this isn’t automatic. Continuous British surpluses in the gold standard era were compatible with steady growth of the world economy because they financed investment — in railroads especially — in the peripheral countries, using British capital goods. The general lesson is:

If countries want to carry international surpluses indefinitely the suggestion here is they need also to reinvest those “savings” into capacity expanding investments abroad.

Also in FT Alphaville, here’s a nice post by Matthew Klein on a question that should be obvious, but is seldom asked: If large current account deficits are dangerous, then what exactly is the purpose of allowing free flows of portfolio investment across borders? From the point of view of the receiving country, the only benefit of portfolio inflows is that it lets them finance current account deficits. If that’s not desirable, why allow them? Klein doesn’t give the clear negative answer that I would, but it’s the right question to be asking.


Evicted. At Dissent, my Roosevelt colleague Mike Konczal has an excellent review of two new books on eviction and foreclosure. It’s an important topic, and Evicted looks like an important book. I had some debates about it on twitter that clarified a question that doesn’t quite come out in the review itself. Are housing costs so high for more people because of market and regulatory failures that allow landlords to exploit poor tenants? Or is the cost of providing adequate housing simply greater than poor families can pay? The first points toward tenants organizing and better regulation of rental housing, the latter toward direct or indirect subsidies or direct public provision of housing.

Also from Mike, a review of two recent books about the appropriate role of the state.


Rising health costs in Europe. Via Adam Gaffney, here’s an interesting article on rising household payments for heatlh care in Europe, even in countries that are notionally single payer. Adam’s summary:

 It supports the hypothesis—put forward by many—that there has been a *partial* retreat from universal health care in Europe (especially if we define universal health care as free care at point of use for all). The main findings are as follows:

-The odds of having any out-of-pocket expenditures on health care in the previous 12 months (among 11 European nations) were 2.6 fold higher in 2013 than in 2006-2007;

-Overall out of pocket payments for health care increased 43.6% (inflation adjusted) between 2006-2007 and 2013;

-The proportion of individuals with catastrophic health care expenditures rose, particularly in Spain and Italy, which have been particularly hard-struck by austerity.

My take: We need to stop thinking about universal health care as an end goal or terminus: its actually a work in progress, and neoliberal health policy ideology has already done a number on it in Europe.


The poor stay poor. My old UMass comrade Mike Carr has a new article on income mobility, coauthored with Emily Wiemers. There’s a nice writeup of it in The Atlantic.


The right vs the rentiers? I was interested to learn that one of Theresa May’s declared priorities as Prime Minister is reforming corporate governance, including requiring worker representatives on boards. I have no idea if anything will come of it, but it’s interesting to see ideas that would be well to the left of the mainstream here adopted at least rhetorically by a conservative government in the UK. Was also interesting, in the coverage, to see some acknowledgement of the importance of cogovernance and works councils in Germany. Obviously export surpluses should not be taken as the measure of economic success in any broader sense, but it’s still worth pointing out that Europe’s biggest exporter is one of its least liberal economies.

Also in Theresa May news, doesn’t it seem like if Article 50 can’t be invoked without Scotland’s ok, that means Brexit isn’t happening? Which I think was the safe bet all along. Because if what scares you is that the “burghers of middle England” can “with a single vote destroy trillions of dollars of value,” then you can probably relax. The trillions will win the next round.

Trend, Forecast and Actual: Decomposing the Differences

Second post in a series. Post one is here.

The previous post argued that if we want to know how much of the slowdown in US growth is a result of the Great Recession, a reasonable starting point is to look at revisions to estimates of potential GDP since the recession. As it turns out, while CBO forecasts prior to the recession did predict slower growth than the long-run trend, the predicted slowdown was only about a quarter what we’ve actually seen. That suggests that most of the output shortfall relative to trend is due to the collapse in demand following the financial crisis, rather than to slower growth in the economy’s productive capacity.

The next natural step is to separate slower growth into various components and see how they behave individually. There are various ways to do this, but perhaps the most straightforward is the identity:

output = productivity * employment  = productivity * laborforce * (1 – unemployment)

The big advantage of this is that we are working with fairly directly observable aggregates. Another advantage, important for present purposes, is that the CBO gives the relevant components for its estimates of potential output. Productivity here means labor productivity — output per worker. As applied to potential, unemployment means the non-accelerating inflation rate of unemployment, or NAIRU — the unemployment rate supposed to be consistent with stable inflation, which is targeted by the central bank.

So, here are the CBO’s forecasts of the three components over the past 10 years. The format is the same as the figure for output in the previous post: The horizontal axis is the year being forecasted, and the different lines represent forecasts made in various years — the blue-green ones before the start of the recession, the orange-red ones after it. (The forecasts are published in January, so the 2009 one is the first to incorporate data from the recession.) The heavy black lines show the actual historical behavior of the variable.cbo productivitycbo laborforce

In the following graph, the forceast lines are for the NAIRU, the black line is for the actual unemployment rate.

cbo nairu

We see some interesting things here. With respect to productivity, there are modest downward adjustments in 2007 and 2008 but the big adjustment come later, especially in 2009 and 2014. And the later adjustments are not just to the level of productivity but to the trend.  Not only is there no convergence between actual productivity and pre-recession forecasts, the gap has continued to get wider over time. For laborforce, by contrast, the biggest adjustments come before the recession, especially in 2003, when the trend is revised downward. The post-recession revisions are smaller. The actual trajectory of the laborforce does show a definite reversion toward the immediate pre-recession forecasts. Finally, the estimated NAIRU was adjusted upward during the recession and back down since then with no systematic movement one way or the other. So the fairly stable gap between post-recession output and the pre-recession trend is a bit misleading. It combines two opposite developments, a widening productivity gap and a narrowing laborforce gap.

These results are summarized in the following table. The first column shows the difference between actual 2016 output and what you would predict by projecting forward the 1990-2006 trend. [1] The second column shows the deviation from trend that was already predicted in the CBO’s 2006 forecasts for 2016. The third column shows the revisions made since 2006.

Actual vs Trend Predicted vs Trend Post-Recession Revision
Output -14.1 -4.2 -10.4
Productivity -5.4 5.1 -8.7
Laborforce -9.2 -8.9 -1.8
Unemployment -0.3 -0.4 0.1

What do we see here? Again, if we look at the shortfall of GDP relative to the pre-2006 trend, about 30 percent was predicted by the CBO. But the picture is quite different for employment and productivity taken separately. The deceleration in laborforce growth (which is about one-third slower population growth, two-thirds declining laborforce participation) was almost entirely predicted by the CBO. But in 2006 the CBO was also predicting above-trend productivity growth, which would have largely offset slower growth of the laborforce. The downward revisions over the past decade have mainly been to productivity — 9 percent, versus only a 2 percent downward revision to potential laborforce. Unemployment does not play an important role in either case — both actual unemployment and the estimated NAIRU are very close to their 2006 values. (This is different from Europe, where higher NAIRUs explain a large part of the change in potential output.)

Now this is a bit of a puzzle. I mentioned in the previous post a couple articles on hysteresis; I also very much like this piece by Laurence Ball. But all of them discuss hysteresis primarily in terms of the laborforce — the long-term unemployed giving up on job search and so on. That doesn’t mesh well with the fact that the downward revisions in potential output reflect mainly slower productivity growth rather than slower laborforce growth.

One natural way to interpret this is that (as Claudia Sahm suggests on twitter) the downward revisions in potential output since 2007 simply reflect a correction to earlier overestimates to productivity growth, which perhaps gave too much weight to a one-time acceleration in the 1990s. I ‘ll return in a later post to why I don’t accept this. For now, let’s just say that we take seriously the Summers-Ball view that downward revisions to potential output since the recession are a measure of hysteresis. Then we have to broaden our understanding of what hysteresis means. We can’t think of it as mainly a labor-market phenomenon.

In the next post, I’ll discuss a couple remaining points on the CBO forecasts. Then, a post arguing that the simultaneous deceleration of employment, productivity and prices looks more like an extended business-cycle downturn than a decline in the economy’s productive capacity. Then we’ll look at demographics and laborforce participation. And then back to the question of productivity, which I’d like to link to Joan Robinson’s concept of disguised unemployment.


[1] I use the years 1990 and 2006 because those are two years where actual output is very close to the CBO estimate of potential.

What Do Changing Estimates of Potential Output Tell Us?

I want to revisit the question we were debating last spring, about the space for additional expansionary policy in the US. How far is the economy from potential, in whatever relevant sense? This post will be the first in a series, and there will be a paper sometime in the fall.

*

One way to approach the question is to ask another one: How much of the shortfall in output relative to the pre-2008 trend is the result of the recession, as opposed to “structural” factors that would have led to slower growth in any case? The two questions are somewhat independent: Even if demographic factors, let’s say, were tending to reduce laborforce growth, there’s no reason in principle that couldn’t be overcome by stronger demand. On the other hand, even if we reject the idea that the recession itself resulted from a decline in productive capacity, it’s possible that a persistent demand shortfall could over time damage capacity in a way that can’t subsequently be repaired by restoring demand. Still, an output shortfall that is due to the collapse in spending in 2008-2009 is more likely to be reversed by increased spending, than one that is due to other causes.

Laurence Ball, DeLong and Summers, and Fatas and Summers, among others, try to answer the question of how much the decline in output is due to the recession, by comparing pre-recession estimates of potential output with more recent ones. A change in potential output attributable to changes in current output is often referred to as “hysteresis.” Changing forecasts are a reasonable measure of hysteresis: If predictable that structural factors like the changing age mix of the population were going to lead to slower growth, then it should in fact have been predicted; so systematic deviations from the forecasts must reflect something else. Now, if you are committed to the view that demand effects are strictly short-run, then a persistent deviation from trend necessarily reflects supply-side developments of some kind. But as long as we have no strong priors either way, the evolution of estimated potential over time should be informative about how much of the output shortfall is the result of the recession and how much is due to other causes.

The three papers do different versions of this exercise and all find that (1) the bulk of the slowdown in growth since 2008 is due to the recession, or at least was not predicted prior to it; and (2) there is no tendency for output to return to potential, rather, changes in current output are fully passed through to later estimates of potential. Here’s a simple version. The figure shows the CBO’s 10-year forecasts of potential GDP from 2002 through this year, along with historical GDP. (All are in 2009 dollars.)

potentialGDPThe horizontal axis shows the year the estimate is for. The different lines show estimates made in different years. So the purple line at the top is the ten-year forecast of potential output published in January 2002, while the pink line at the bottom is the ten-year forecast published in January of this year. What do we see?

First, there has been a systematic reduction in estimates of potential. While there are some upward adjustment in the early years, more recently all the adjustments have been downward. The estimates of 2015, for example, first made in 2005, has been reduced every year since then. Same goes for 2016 and all future years. These are not random errors. And they are not small: the estimate of 2016 potential GDP made by the CBO in 2016 was more than 10 percent greater than the estimate this year.

Second, there is no tendency for output to return to earlier estimates of potential. While the official output gap has gotten much smaller since 2009, this is entirely a result of the downward adjustment of potential; there has been no closing of the gap between output and potential estimated in 2009 or earlier years.

On the other hand, these revisions can’t be all due to the recession, since the CBO significantly reduced its forecasts of potential output growth over 2005-2007. The largest revision comes in 2009, after the first year of recession. (Again, these are January forecasts.) But there had already been significant downward adjustments at that point. (Especially, as we’ll see in the net post, in predicted laborforce growth.) Still, most of the deviation from trend reflects post-recession adjustments in potential.

It breaks down like this. Current GDP is 12 percent below what you would have predicted based on long-run growth rates up to 2008. The CBO puts the current output gap at around 2 percent. This reflects the fact that the CBO currently considers full employment to be 4.8 percent unemployment, slightly below the current level. The remainder of the 12-point gap represents a slowdown in potential output growth. How much of that was predicted in 2005? Less than none – at that time, the CBO’s forecast for 2015 output was 1.5 percent above the long run trend. By January 2008 — the last pre-recession forecast — the CBO had revised its 2015 forecast down by about 4 percent, to 3 percent below trend. In 2009, after the first year of the recession, it revised it down another 3 points, to 6 percent below trend. And over the past seven years it’s been revised down seven more times for a total of 5 points, to reach the current estimate of potential of around 10 percent below trend. So about a quarter of the 12 point gap between current GDP and its long-run trend was predicted before the recession.

Now the fact that the slowdown was not predicted before the recession, doesn’t prove that it is due to the recession. It does, I think, allow us to reject things like “aging of the baby boomers” as the main explanation for the shortfall: Something that easily predictable, would have been predicted. (And as we’ll see in a later post, demographic changes cannot in fact explain the slowdown in output growth— the effect of aging on labor force participation, while real, is too small to explain the actual decline, and it’s offset by a comparable but less-discussed shift in the other direction — the declining share of households with young children.) It is, however, possible that some new development (a “shock” in the jargon, but I don’t like this term) just happened to reduce the economy’s productive capacity at the same time it was recovering from the recession.

In their 2012 article, DeLong and Summers argue that the absence of wage and price growth is strong evidence against this latter explanation:

It is possible that these revisions reflect not … hysteresis but merely the recognition that previous forecasts of potential output were too high. However, an elementary signal extraction point rebuts this interpretation. … one should not reduce one’s estimate of potential output if lower-than-previously-expected levels of production are associated with lower-than-previously-expected levels of inflation. … Typically, the bad news that leads to a marking down of potential output is not news that output is lower than, but rather news that output and inflation together are above, their anticipated co-movement line. Such news is not in evidence.

Over the past four years inflation has only fallen further, so the point presumably still holds.

So if we take the unpredicted decline in potential as a measure of the effects of the recession, we’re left with something like this: Of the gap between actual US GDP and its pre-2008 trend, 75 percent is due to the continuing effects of the recession, 25 percent to other factors. That seems like a reasonable place to start.

I Don’t See Any Method At All

I’ve felt for a while that most critiques of economics miss the mark. They start from the premise that economics is a systematic effort to understand the concrete social phenomena we call “the economy,” an effort that has gone wrong in some way.

I don’t think that’s the right way to think about it. I think McCloskey was right to say that economics is just what economists do. Economic theory is essentially closed formal system; it’s a historical accident that there is some overlap between its technical vocabulary and the language used to describe concrete economic phenomena. Economics the discipline is to the economy the sphere of social reality as chess theory is to medieval history: The statement, say, that “queens are most effective when supported by strong bishops” might be reasonable in both domains, but studying its application in the one case will not help at all in applying it in in the other. A few years ago Richard Posner said that he used to think economics meant the study of “rational” behavior in whatever domain, but after the financial crisis he decided it should mean the study of the behavior of the economy using whatever methodologies. (I can’t find the exact quote.) Descriptively, he was right the first time; but the point is, these are two different activities. Or to steal a line from my friend Suresh, the best way to think about what most economists do is as a kind of constrained-maximization poetry. Makes no more sense to ask “is it true” than of a haiku.

One consequence of this is, as I say, that radical criticism of the realism or logical consistency of orthodox economics do nothing to get us closer to a positive understanding of the economy. How is a raven unlike a writing desk? An endless number of ways, and enumerating them will leave you no wiser about either corvids or carpentry. Another consequence, the topic of the remainder of this post, is that when we turn to concrete economic questions there isn’t really a “mainstream” at all. Left critics want to take academic orthodoxy, a right-wing political vision, and the economic policy preferred by the established authorities, and roll them into a coherent package. But I don’t think you can. I think there is a mix of common-sense opinions, political prejudices, conventional business practice, and pragmatic rules of thumb, supported in an ad hoc, opportunistic way by bits and pieces of economic theory. It’s not possible to deduce the whole tottering pile from a few foundational texts.

More concretely: An economics education trains you to think in terms of real exchange — in terms of agents who (somehow or other) have come into possession of a bundle of goods, which they trade with each other. You can only use this framework to make statements about real economic phenomena if they are understood in terms of the supply side — if economic outcomes are understood in terms of different endowments of goods, or different real uses for them. Unless you’re in a position to self-consciously take another perspective, fitting your understanding of economic phenomena into a broader framework is going to mean expressing it as this kind of story, about the limited supply of real resources available, and the unlimited demands on them to meet real human needs. But there may be no sensible story of that kind to tell.

More concretely: What are the major macroeconomic developments of the past ten to twenty years, compared, say, with the previous fifty? For the US and most other developed countries, the list might look like:

– low and falling inflation

– low and falling interest rates

– slower growth of output

– slower growth of employment

– low business investment

– slower growth of labor productivity growth

– a declining share of wages in income

If you pick up an economics textbook and try to apply it to the world around you, these are some of the main phenomena you’d want to explain. What does the orthodox, supply-side theory tell us?

The textbook says that lower inflation is normally the result of a positive supply shock — an increase in real resources or an improvement in technology. OK. But then what do we make of the slowdown in output and productivity?

The textbook says that, over the long run interest rates must reflect the marginal product of capital — the central bank (and monetary factors in general) can only change interest rates in the short run, not over a decade or more. In the Walrasian world, the interest rate and the return on investment are the same thing. So a sustained decline in interest rates must mean a decline in the marginal product of capital.

OK. So in combination with the slowdown in output growth, that suggests a negative technological shock. But that should mean higher inflation. Didn’t we just say that lower inflation implies a positive technological shock?

Employment growth in this framework is normally determined by demographics, or perhaps by structural changes in labor markets that change the effective labor supply. Slower employment growth means a falling labor supply — but that should, again, be inflationary. And it should be associated with higher wagess: If labor is becoming relatively scarce, its price should rise. Yes, the textbook combines a bargaining mode of wage determination for the short run with a marginal product story for the long run, without ever explaining how they hook up, but in this case it doesn’t matter, the two stories agree. A fall in the labor supply will result in a rise in the marginal product of labor as it’s withdrawn from the least productive activities — that’s what “marginal” means! So either way the demographic story of falling employment is inconsistent with low inflation, with a falling wage share, and with the showdown in productivity growth.

Slower growth of labor productivity could be explained by an increase in labor supply  — but then why has employment decelerated so sharply? More often it’s taken as technologically determined. Slower productivity growth then implies a slowdown in innovation — which at least is consistent with low interest rates and low investment. But this “negative technology shock” should again, be inflationary. And it should be associated with a fall in the return to capital, not a rise.

On the other hand, the decline in the labor share is supposed to reflect a change in productive technology that encourages substitution of capital for labor, robots and all that. But how is this reconciled with the fall in interest rates, in investment and in labor productivity? To replace workers with robots, someone has to make the robots, and someone has to buy them. And by definition this raises the productivity of the remaining workers.

Which subset of these mutually incompatible stories does the “mainstream” actually believe? I don’t know that they consistently believe any of them. My impression is that people adopt one or another based on the question at hand, while avoiding any systematic analysis through violent abuse of the ceteris paribus condition.

To paraphrase Leijonhufvud, on Mondays and Wednesdays wages are low because technological progress has slowed down, holding down labor productivity. On Tuesdays and Thursdays wages are low because technological progress has sped up, substituting capital for labor. Students may come away a bit confused but the main takeaway is clear: Low wages are the result of inexorable, exogenous technological change, and not of any kind of political choice. And certainly not of weak aggregate demand.

Larry Summers in this actually quite good Washington Post piece, at least is no longer talking about robots. But he can’t completely resist the supply-side lure: “The situation is worse in other countries with more structural issues and slower labor-force growth.” Wait, why would they be worse? As he himself says, “our problem today is insufficient inflation,” so what’s needed “is to convince people that prices will rise at target rates in the future,” which will “require … very tight markets.” If that’s true, then restrictions on labor supply are a good thing — they make it easier to generate wage and price increases. But that is still an unthought.

I admit, Summers does go on to say:

In the presence of chronic excess supply, structural reform has the risk of spurring disinflation rather than contributing to a necessary increase in inflation.  There is, in fact, a case for strengthening entitlement benefits so as to promote current demand. The key point is that the traditional OECD-type recommendations cannot be right as both a response to inflationary pressures and deflationary pressures. They were more right historically than they are today.

That’s progress, for sure — “less right” is a step toward “completely wrong”. The next step will be to say what his argument logically requires. If the problem is as he describes it then structural “problems” are part of the solution.

How Should We Count Debt Owed to the Fed?

How big is US government debt? If you google this question looking for a number, your first hit is likely to be a site like this, giving a figure (as of June 2016) around $19.5 trillion, or a bit over 100 percent of GDP. That’s the total public debt as reported by the US Treasury.

If you are reading this blog, you probably don’t take that number at face value. You probably know the preferred number is federal debt held by the public. As of June 2016, that’s $14 trillion, or a bit over 70 percent of GDP. That’s the number more likely to be used in academic papers or by official bodies. (Wikipedia seems to mix the two numbers at random.)

Debt held by the public is meant to exclude debt the federal government owes to itself.  For the US, that means subtracting the $2.8 trillion in debt held by the Social Security trust fund, the $1.7 trillion held by by federal employee retirement funds, and $1 trillion various other federal trust funds. It leaves in, however, the debt held by the Federal Reserve.

I wonder how many people, the sort of people who read this blog, know that. I wonder how many people know that today, one fifth of the federal debt “held by the public” is actually held by the Fed. I certainly didn’t, until recently.

Here’s a breakdown of federal debt by who owns it. Total public debt is the whole thing. Debt held by the public is the heavy black line. Debt held by the Fed is the blue area just below that line. (Source is various series from the Financial Accounts.)

debt-holdingsAs you can see, the Fed accounts for quite a bit of federal debt holdings — $2.5 trillion, 16 percent of GDP, or 19 percent of debt “held by the public”.

There’s some other interesting stuff in there. Most obviously, the dramatic fall in the share of debt held by households and nonfinancial businesses (the orange area), and rise of the foreign share (yellow). In the 1950s Abba Lerner could talk with some plausibility about the demand-boosting effects of federal interest payments to households; but it’s silly to suggest — as some modern Lernerians do — that higher rates might boost demand through this channel today. The declining share of the financial sector (red) is also interesting. I’ve suggested that this was a factor in rising liquidity premiums and financial fragility. If, as Zoltan Pozsar argues, we’re seeing a lasting shift from “market liquidity” to “base liquidity” this may include a permanently larger share of federal debt on bank balance sheets.

But what about the Fed share? Should it be counted in debt held by the public, or not? I can’t find the reference at the moment, but I believe there is no consistent rule on this between countries. (As I recall, the UK excludes it.) In any case, the phenomenon of large central bank holdings of government debt is not unique to the US. Here, from the OECD (p. 41), are the shares of government debt held by central banks in various countries:

Screen Shot 2016-06-02 at 9.33.51 AM

If you want to say that debt held by the Fed definitely shouldn’t be counted, I won’t object. After all, any interest earnings on the debt are simply returned to the Treasury at the end of the year, so this debt literally represents payments the government is making to itself. But that’s not what I want to say. To be honest, I can see valid arguments on both sides — yes, the Fed is a part of government just as much as the Social Security Administration; but on the other hand, the Fed’s holdings were acquired in market purchases from the private sector, while the holdings of the various trust funds are nonmarketable securities that exist only as bookkeeping devices for future payments to beneficiaries. And if you think the Fed will reduce its holdings in the near future, then it makes sense to count them for any target you might have for holdings by the private sector. But of course, in that case how much you count them will depend on whether, when and how much you think the Fed will unwind its 2009-2013 balance sheet expansions. And this is my point: There is no true level of the federal debt. The “debt” is not an object out in the world. It is a way of talking about some set of the payment commitments by some set of economic units, sets whose boundaries are inherently arbitrary.

Again, debt “held by the public” does not include the notional debt in the Social Security Trust Fund, or in the various retirement funds for  federal employees. But what about the debt (currently about 5 percent of GDP) held by state and local governments in similar trust funds? Fundamentally, these represent commitments by the federal government to help with pension payments to retired state and local government employees. But this is the same commitment embodied in the Social Security Trust Fund. And on the other hand, the federal government has a vast number of payment commitments to state and local governments — transfers from the federal government make up more than a quarter of total state government revenue. Why count the commitments that happen to be recorded as debt holding in retirement funds as federal debt but not the rest of them?

For that matter, what about the future claims of Social Security recipients? They certainly represent payment commitments by the federal government. Lawrence Kotlikoff thinks there is no difference between the commitment to make future Social Security payments and the commitment to make payments on the debt, so we should add them up and say debt held by the public is over 200 percent of GDP. Other people want to add in public pensions of all kinds. Why not throw in Medicare, too? True, retirement benefits are not marketable, but checking your expected benefits at https://www.ssa.gov/myaccount is not much harder than checking your bank balance online. And for the MMT-inclined, don’t future Social Security benefits have as good a claim to be “net wealth” for the private sector as federal debt, maybe better?

One takeaway from all this is the point eloquently made by Merijn Knibbe, that one of the big problems in the economics profession today is the complete disconnect between theory and measurement. Most public discussions and economic models — and a lot of empirical work for that matter — treat “debt”  as an object that simply exists in the world. (It’s worth noting that the question of how exactly debt is defined, and who it is owed to, does get some attention in undergraduate econ textbooks, but none at all in graduate ones.) It seems to me that the large share of debt held by central banks is a case in point of how we have to make a conscious choice about which commitments we classify as “debt”, and recognize that the best place to draw the line is going to depend on the question we’re asking. We need to treat economic categories like debt not as primitives but as provisional shorthand, and we need to be constantly walking back and forth between our abstractions and the concrete phenomena they are trying to describe. You can’t, it seems to me, do useful scholarship on something like government debt, except on the basis of a deep engagement with the concrete practices and public debates that the term is part of.

More concretely: Whenever you take a functional finance line, someone is going to stand up and start demanding in a prosecutorial tone whether you really think government debt could rise to 10 times or 100 times GDP. How about 1,000 times? a million times? — until you say something noncommittal and move on to the next question (or mute them on Twitter). But of course the answer is, it depends. It depends, first, on the concrete institutional arrangements under which debt is held, which determine both economic impacts and financial constraints, if any.  (For example, whether the debt held by central banks should be counted as held by the public depends on when or if those positions will be unwound.) And it depends, second, on how we are counting debt.

Consider a trust fund holding federal debt. What the federal government has actually committed to is a stream of payments in the future which in turn will allow the fund to fulfill its own payment commitments. Converting that flow of future payments to a liability stock in the present depends on the discount rate we assign to them. But we can follow that same procedure for any future spending, whether or not it is officially recognized as someone’s asset. As Dean Baker likes to say, given that we don’t prefund education, the military, etc., pretty much all government spending could be called an unfunded liability for the federal government. How big a liability depends on the discount rate. If the discount rate is less than the nominal growth rate, then the present value of future spending grows without limit as we consider longer periods.

Here’s an exercise. Let’s go full Kotlikoff and call all future government spending a liability of taxpayers today. Say that federal spending is a constant 20 percent of GDP and nominal growth is 5 percent per year.  If we use the current 10-year Treasury rate of around 2 percent as our discount rate, then the present value of federal spending over the next 20 years works out to, let’s see, $10 quadrillion, or 55,000 percent of GDP. That’s $30 million per person. Whoa. Can I have a Time magazine cover story now? [No I cannot, because I am bad at math. See below.]

So yeah. 20 percent of debt “held by the public” is actually owed to the Fed. An interesting fact which perhaps you did not know.


UPDATE: As commenter Matt points out below, the math in the next-to-last paragraph is wrong. The calculation as given yields $110  trillion, a measly 600 percent of GDP. On the other hand, if we stretch it out to the next 30 years, we get nearly $200 trillion, which is 1,000 percent of GDP or more than $600,000 per person. I guess that will do.