I want to revisit the question we were debating last spring, about the space for additional expansionary policy in the US. How far is the economy from potential, in whatever relevant sense? This post will be the first in a series, and there will be a paper sometime in the fall.
*
One way to approach the question is to ask another one: How much of the shortfall in output relative to the pre-2008 trend is the result of the recession, as opposed to “structural” factors that would have led to slower growth in any case? The two questions are somewhat independent: Even if demographic factors, let’s say, were tending to reduce laborforce growth, there’s no reason in principle that couldn’t be overcome by stronger demand. On the other hand, even if we reject the idea that the recession itself resulted from a decline in productive capacity, it’s possible that a persistent demand shortfall could over time damage capacity in a way that can’t subsequently be repaired by restoring demand. Still, an output shortfall that is due to the collapse in spending in 2008-2009 is more likely to be reversed by increased spending, than one that is due to other causes.
Laurence Ball, DeLong and Summers, and Fatas and Summers, among others, try to answer the question of how much the decline in output is due to the recession, by comparing pre-recession estimates of potential output with more recent ones. A change in potential output attributable to changes in current output is often referred to as “hysteresis.” Changing forecasts are a reasonable measure of hysteresis: If predictable that structural factors like the changing age mix of the population were going to lead to slower growth, then it should in fact have been predicted; so systematic deviations from the forecasts must reflect something else. Now, if you are committed to the view that demand effects are strictly short-run, then a persistent deviation from trend necessarily reflects supply-side developments of some kind. But as long as we have no strong priors either way, the evolution of estimated potential over time should be informative about how much of the output shortfall is the result of the recession and how much is due to other causes.
The three papers do different versions of this exercise and all find that (1) the bulk of the slowdown in growth since 2008 is due to the recession, or at least was not predicted prior to it; and (2) there is no tendency for output to return to potential, rather, changes in current output are fully passed through to later estimates of potential. Here’s a simple version. The figure shows the CBO’s 10-year forecasts of potential GDP from 2002 through this year, along with historical GDP. (All are in 2009 dollars.)
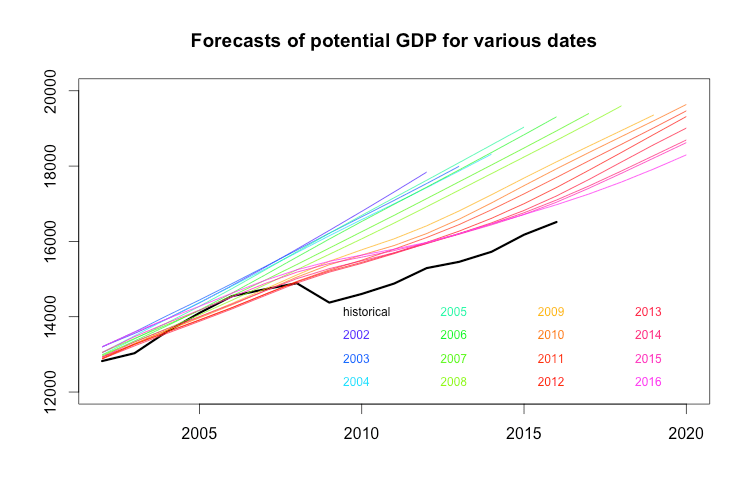 The horizontal axis shows the year the estimate is for. The different lines show estimates made in different years. So the purple line at the top is the ten-year forecast of potential output published in January 2002, while the pink line at the bottom is the ten-year forecast published in January of this year. What do we see?
First, there has been a systematic reduction in estimates of potential. While there are some upward adjustment in the early years, more recently all the adjustments have been downward. The estimates of 2015, for example, first made in 2005, has been reduced every year since then. Same goes for 2016 and all future years. These are not random errors. And they are not small: the estimate of 2016 potential GDP made by the CBO in 2016 was more than 10 percent greater than the estimate this year.
Second, there is no tendency for output to return to earlier estimates of potential. While the official output gap has gotten much smaller since 2009, this is entirely a result of the downward adjustment of potential; there has been no closing of the gap between output and potential estimated in 2009 or earlier years.
On the other hand, these revisions can’t be all due to the recession, since the CBO significantly reduced its forecasts of potential output growth over 2005-2007. The largest revision comes in 2009, after the first year of recession. (Again, these are January forecasts.) But there had already been significant downward adjustments at that point. (Especially, as we’ll see in the net post, in predicted laborforce growth.) Still, most of the deviation from trend reflects post-recession adjustments in potential.
It breaks down like this. Current GDP is 12 percent below what you would have predicted based on long-run growth rates up to 2008. The CBO puts the current output gap at around 2 percent. This reflects the fact that the CBO currently considers full employment to be 4.8 percent unemployment, slightly below the current level. The remainder of the 12-point gap represents a slowdown in potential output growth. How much of that was predicted in 2005? Less than none – at that time, the CBO’s forecast for 2015 output was 1.5 percent above the long run trend. By January 2008 — the last pre-recession forecast — the CBO had revised its 2015 forecast down by about 4 percent, to 3 percent below trend. In 2009, after the first year of the recession, it revised it down another 3 points, to 6 percent below trend. And over the past seven years it’s been revised down seven more times for a total of 5 points, to reach the current estimate of potential of around 10 percent below trend. So about a quarter of the 12 point gap between current GDP and its long-run trend was predicted before the recession.
Now the fact that the slowdown was not predicted before the recession, doesn’t prove that it is due to the recession. It does, I think, allow us to reject things like “aging of the baby boomers” as the main explanation for the shortfall: Something that easily predictable, would have been predicted. (And as we’ll see in a later post, demographic changes cannot in fact explain the slowdown in output growth— the effect of aging on labor force participation, while real, is too small to explain the actual decline, and it’s offset by a comparable but less-discussed shift in the other direction — the declining share of households with young children.) It is, however, possible that some new development (a “shock” in the jargon, but I don’t like this term) just happened to reduce the economy’s productive capacity at the same time it was recovering from the recession.
In their 2012 article, DeLong and Summers argue that the absence of wage and price growth is strong evidence against this latter explanation:
It is possible that these revisions reflect not … hysteresis but merely the recognition that previous forecasts of potential output were too high. However, an elementary signal extraction point rebuts this interpretation. … one should not reduce one’s estimate of potential output if lower-than-previously-expected levels of production are associated with lower-than-previously-expected levels of inflation. … Typically, the bad news that leads to a marking down of potential output is not news that output is lower than, but rather news that output and inflation together are above, their anticipated co-movement line. Such news is not in evidence.
Over the past four years inflation has only fallen further, so the point presumably still holds.
So if we take the unpredicted decline in potential as a measure of the effects of the recession, we’re left with something like this: Of the gap between actual US GDP and its pre-2008 trend, 75 percent is due to the continuing effects of the recession, 25 percent to other factors. That seems like a reasonable place to start.
This is very good.
I’d be interested in seeing CBO projections going back to 1998. familiarity with those reports through godley suggests that CBO is persistently wildly optimistic.
this does raise the question of CBO models as the “real problem”.
I think it would be better to disaggregate” growth” in three components:
1: growth in productivity per hour
2: growth in the potential working population (demographics)
3: changes in the proportion of the population that is actually working
Because there is a lot of difference between the idea that productivity growth slowed and the idea that the” natural rate of unemployment” rose, but both are mixed in the concept of hysteresis.
Also I think that productivity can be understated if there is under consumption, but I don’t know how this can be measured.
I think it would be better to disaggregate” growth” in three components:
1: growth in productivity per hour
2: growth in the potential working population (demographics)
3: changes in the proportion of the population that is actually working
That is exactly what I am going to do in the next post(s).
I humbly bow to your superior wisdom!
“… these revisions can’t be all due to the recession, since the CBO significantly reduced its forecasts of potential output growth over 2005-2007.”
Yes. The “new economy” of the 1990s caused CBO to push potential output higher, on the assumption that the good years would continue. But the bottom fell out of productivity in 2004, requiring the downward revisions you mention.
That’s one possibility, for sure.
The Fed has the economy exactly where it wants it to be!
https://thefaintofheart.wordpress.com/2016/06/05/were-almost-there-a-narrative/
Thanks, good post.
I don’t entirely agree with it, but this is the conversation we need to be having. One of the underlying reasons I’m interested in the question of potential is that it’s part of making the Fed’s conduct of macropolicy a more explicitly political question, as it should be.
We really need more discussion and research about Verdoorn’s law.
https://en.wikipedia.org/wiki/Verdoorn%27s_law
It would seem to me that this, better than any silly discussion of secular stagnation, or permanent productivity decline (even while people are droning on about robots taking all of our jobs), would explain what is going on.