The Depression didn’t just see a fall in employment, it saw a fall in the output of those still employed, reversing much of the productivity gains of the 1920s. (This surprised Keynes, among others, who still believed in the declining marginal product of labor, which predicted the opposite.) Recovery in the late 1930s, conversely, didn’t just mean higher employment, it involved a sharp acceleration in labor productivity. There’s a widespread idea that output per worker necessarily reflects supply-side factors — technology, skills, etc. But if demand had such direct effects on labor productivity in the Great Depression, why not in the Lesser Depression too? But for some reason, people who scoff at the idea of the “Great Forgetting” of the 1930s have no trouble believing that the drastic slowdown in productivity growth of recent years has nothing to do with the economic crisis it immediately followed.
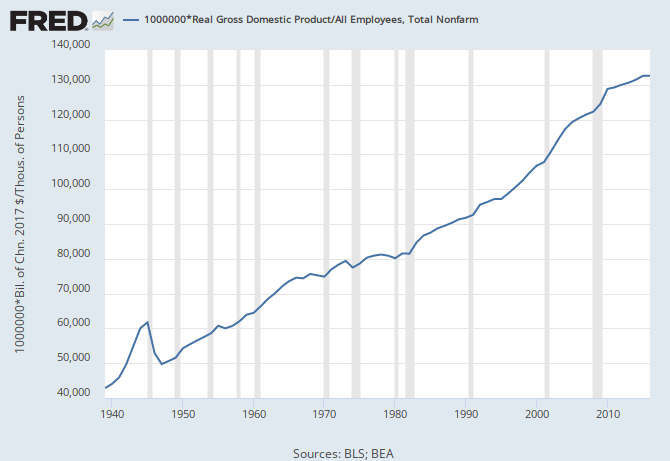
EDIT: I should add: While the decline in production during the Depression was, of course, primarily a matter of reduced employment, the decline in productivity was not trivial. If output per employee had continued to rise in the first half of the 1930s at the same rate as in 1920s, the total fall in output would have been on the order of 25 percent rather than 33 percent.
Note also that the only other comparable (in fact larger) fall in GDP per worker came in the immediate postwar demobilization period 1945-1947. I’ve never understood the current convention that says we should ignore the depression and wartime experience when thinking about macroeconomic relationships. Previous generations thought just the opposite — that we can learn the most about how the system operates from these kinds of extreme events, that “the prime test of Keynesian theory must be the Great Depression.” Isn’t it logical, if you want to understand how shifts in aggregate demand affect economic outcomes, that you would look first at the biggest such shifts, where the effects should be clearest? The impact of these two big demand shifts on output per worker, seem like good reason to expect such effects in general.
And it’s not hard to explain why. In real economies, there are great disparities in the value of the labor performed by similar people, and immense excess capacity in the form of low-productivity jobs accepted for lack of anything better. Increased demand mobilizes that capacity. When the munitions factories are running full tilt, no one works shining shoes.
DeLong rises to defend Ben Bernanke, against claims that unconventional monetary policy in recent years has discouraged businesses from investing. Business investment is doing just fine, he says:
As I see it, the Fed’s open-market operations have produced more spending–hence higher capacity utilization–and lower interest rates–has more advantageous costs of finance–and we are supposed to believe that its policies “have hurt business investment”?!?! … As I have said before and say again, weakness in overall investment is 100% due to weakness in housing investment. Is there an argument here that QE has reduced housing investment? No. Is nonresidential fixed investment below where one would expect it to be given that the overall recovery has been disappointing and capacity utilization is not high?
As evidence, DeLong points to the fact that nonresidential investment as a share of GDP is back where it was at the last two business cycle peaks.
As it happens, I agree with DeLong that it’s hard to make a convincing case that unconventional monetary policy is holding back business investment. Arguments about the awfulness of low interest rates seem more political or ideological, based on the real or imagined interests of interest-receivers than any identifiable economic analysis. But there’s a danger of overselling the opposite case.
It is certainly true that, as a share of potential GDP, nonresidential investment is not low by historical standards. But is this the right measure to be looking at? I think not, for a couple of reasons, one relatively minor and one major. The minor reason is that the recent redefinition of investment by the BEA to include various IP spending makes historical comparisons problematic. If we define investment as the BEA did until 2013, and as businesses still do under GAAP accounting standards, the investment share of GDP remains quite low compared to previous expansions. The major reason is that it’s misleading to evaluate investment relative to (actual or potential GDP), since weak investment will itself lead to slower GDP growth. [1]
On the first point: In 2013, the BEA redefined investment to include a variety of IP-related spending, including the commercial development of movies, books, music, etc. as well as research and development. We can debate whether, conceptually, Sony making Steve Jobs is the same kind of thing as Steve Jobs and his crew making the iPhone. But it’s important to realize that the apparent strength of investment spending in recent expansions is more about the former kind of activity than the latter. [2] More relevant for present purposes, since this kind of spending was not counted as investment — or even broken out separately, in many cases — prior to 2013, the older data are contemporary imputations. We should be skeptical of comparing today’s investment-cum-IP-and-R&D to the levels of 10 or 20 years ago, since 10 or 20 years ago it wasn’t even being measured. This means that historical comparisons are considerably more treacherous than usual. And if you count just traditional (GAAP) investment, or even traditional investment plus R&D, then investment has not, in fact, returned to its 2007 share of GDP, and remains well below long-run average levels. [3]
More importantly, using potential GDP as the yardstick is misleading because potential GDP is calculated simply as a trend of actual GDP, with a heavier weight on more recent observations. By construction, it is impossible for actual GDP to remain below potential for an extended period. So the fact that the current recovery is weak by historical standards automatically pulls down potential GDP, and makes the relative performance of investment look good.
We usually think that investment spending the single most important factor in business-cycle fluctuations. If weak investment growth results in a lower overall level of economic activity, investment as a share of GDP will look higher. Conversely, an investment boom that leads to rapid growth of the economy may not show up as an especially high investment share of GDP. So to get a clear sense of the performance of business investment, its better to look at the real growth of investment spending over a full business cycle, measured in inflation-adjusted dollars, not in percent of GDP. And when we do this, we see that the investment performance of the most recent cycle is the weakest on record — even using the BEA’s newer, more generous definition of investment.
Real investment growth, BEA definition
The figure above shows the cumulative change in real investment spending since the previous business-cycle peak, using the current (broad) BEA definition. The next figure shows the same thing, but for the older, narrower GAAP definition. Data for both figures is taken from the aggregates published by the BEA, so it includes closely held corporations as well as publicly-traded ones. As the figures show, the most recent cycle is a clear outlier, both for the depth and duration of the fall in investment during the downturn itself, and even more for the slowness of the subsequent recovery.
Real investment growth, plant and equipment only
Even using the BEA’s more generous definition, it took over 5 years for inflation-adjusted investment spending to recover its previous peak. (By the narrower GAAP definition, it took six years.) Five years after the average postwar business cycle peak, BEA investment spending had already risen 20 percent in real terms. As of the second quarter of 2015 — seven-and-a-half years after the most recent peak, and six years into the recovery — broad investment spending was up only 10 percent from its previous peak. (GAAP investment spending was up just 8.5 percent.) In the four previous postwar recoveries that lasted this long, real investment spending was up 63, 24, 56, and 21 percent respectively. So the current cycle has had less than half the investment growth of the weakest previous cycle. And it’s worth noting that the next two weakest investment performances of the ten postwar cycles came in the 1980s and the 2000s. In recent years, only the tech-boom period of the 1990s has matched the consistent investment growth of the 1950s, 1960s and 1970s.
So I don’t think it’s time to hang the “Mission Accomplished” banner up on Maiden Lane quite yet.
As DeLong says, it’s not surprising that business investment is weak given how far output is below trend. But the whole point of monetary policy is to stabilize output. For monetary policy to work, it needs to able to reliably offset lower than normal spending in other areas with stronger than normal investment spending. If after six years of extraordinarily stimulative monetary policy (and extraordinarily high corporate profits), business investment is just “where one would expect given that the overall recovery has been disappointing,” that’s a sign of failure, not success.
[1] Another minor issue, which I can’t discuss now, is DeLong’s choice to compare “real” (inflation-adjusted) spending to “real” GDP, rather than the more usual ratio of nominal values. Since the price index for investment goods consistent rises more slowly than the index for GDP as a whole, this makes current investment spending look higher relative to past investment spending.
[2] This IP spending is not generally counted as investment in the GAAP accounting rules followed by private businesses. As I’ve mentioned before, it’s problematic that national accounts diverge from private accounts this way. It seems to be part of a troubling trend of national accounts being colonized by economic theory.
[3] R&D spending is at least reported in financial statements, though I’m not sure how consistently. But with the other new types of IP investment — which account for the majority of it — the BEA has invented a category that doesn’t exist in business accounts at all. So the historical numbers must involve more than usual amount degree of guesswork.
So the Fed decided not to raise rates this weeks. And as you’ve probably seen, this provoked an angry response from representatives of financial institutions. The owners and managers of money have been demanding higher interest rates for years now, and were clearly hoping that this week they’d finally start getting them.
As Paul Krugman points out, it’s not immediately obvious why money-owners are so hostile to low rates:
I’ve tried to understand demands that rates go up despite the absence of inflation pressure in terms of broad class interests. And the trouble is that it’s not at all clear where these interests lie. The wealthy get a lot of interest income, which means that they are hurt by low rates; but they also own a lot of assets, whose prices go up when monetary policy is easy. You can try to figure out the net effect, but what matters for the politics is perception, and that’s surely murky.
But, he has a theory:
What we should be doing … is focusing not on broad classes but on very specific business interests. … Commercial bankers really dislike a very low interest rate environment, because it’s hard for them to make profits: there’s a lower bound on the interest rates they can offer, and if lending rates are low that compresses their spread. So bankers keep demanding higher rates, and inventing stories about why that would make sense despite low inflation.
I certainly agree with Krugman that in thinking about the politics of monetary policy, we should pay attention to the narrow sectoral interests of the banks as well as the broader interests of the owning class. But I’m not sure this particular story makes sense. What he’s suggesting is that the interest rate on bank lending is more strongly affected by monetary policy than is the interest rate on bank liabilities, so that bank spreads are systematically wider at high rates than at low ones.
This story might have made sense in the 1950s and 1960s, when bank liabilities consisted mostly of transactions deposits that paid no interest. But today, non-interest bearing deposits compose less than a quarter of commercial bank liabilities. Meanwhile, bank liabilities are much shorter-term than their assets (that’s sort of what it means to be a bank) so the interest rates on their remaining liabilities tend to move more closely with the policy rate than the interest rates on their assets. So it’s not at all obvious that bank spreads should be narrower when rates are low; if anything, we might expect them to be wider.
Luckily, this is a question we can address with data. Historically, have higher interest rates been associated with a wider spread for commercial banks, or a narrower one? Or have interest rate changes left bank spreads unchanged? To answer this, I looked at total interest income and total interest payments for commercial banks, both normalized by total assets. These are reported in a convenient form, along with lots of other data on commercial banks, in the FDIC’s Historical Statistics on Banking.
The first figure here shows annual interest payments and interest costs for commercial banks on the vertical axis, and the Federal funds rate on the horizontal axis. It’s annual data, 1955 through 2014. The gap between the blue and red points is a measure of the profitability of bank loans that year. [1] The blue and red lines are OLS regression lines.
Fig. 1: Commercial Bank Interest Paid and Received, as a Share of Assets, and the Federal Funds Rate
If Krugman’s theory were correct, the gap between the blue and red lines should be wider on the right, when interest rates are high, and narrower on the left, when they’re low. But in fact, the lines are almost exactly parallel. The gap between banks’ interest earnings and their funding costs is always close to 3 percent of assets, whether the overall level of rates is high or low. The theory that bank lending is systematically less profitable in a low-interest environment does not seem consistent with the historical evidence. So it’s not obvious why commercial banks should care about the overall level of interest rates one way or the other.
Here’s another way of looking at the same thing. Now we have interest received by commercial banks on the vertical axis, and interest paid on the horizontal axis. Again, both are scaled by total bank assets. To keep it legible, I’ve limited it to the years 1985-2014; anyway the earlier years are probably less relevant for today’s banking system. The diagonal line shows the average spread between the lending rate and the funding rate for this period. So points above the line are years when bank loans are unusually profitable, and points below are years when loans are less profitable than usual.
Fig 2: Commercial Bank Interest Paid and Received, as a Percent of Assets
Here again, we see that there is no systematic relationship between the level of interest rates and the profitability of bank loans. Over the whole range of interest rates, spreads are clustered close to the diagonal. What we do see, though, is that the recent period of low interest rates has seen a steady narrowing of bank spreads. Since 2010, the average interest rate received by commercial banks has fallen by one full percentage point, while their average funding cost has fallen by a bit under half a point.
On the face of it, this might seem to support Krugman’s theory. But I don’t think it’s actually telling us anything about the effects of low interest rates as such. Rather, it reflects the fact that bank borrowing is much shorter term than bank lending. So a sustained fall in interest rates will always first widen bank spreads, and then narrow them again as lending rates catch up with funding costs. And in fact, the recent decline in bank spreads has simply brought them back to where they were in 2007. (Or in 1967, for that matter.) No doubt there are still a few long-term loans from the high-rate period that have not been refinanced and are still sitting profitably on banks’ books; but after seven years of ZIRP there can’t be very many. There’s no reason to think that continued low rates will continue to narrow bank spreads, or that higher rates will improve them. On the contrary, an increase in rates would almost certainly reduce lending profits initially, since banks’ funding rates will rise more quickly than their lending rates.
Now, on both substantive and statistical grounds, we might prefer to look at changes rather than levels. So the next two figures are the same as the previous ones, but using the year over year change rather than absolute level of interest rates. In the first graph, years with the blue above the red are years of widening spreads, while red above blue indicates narrowing spreads. In the second graph, the diagonal line indicates an equal change in bank lending and funding rates; points above the line are years of widening spreads, and points below the line are years of narrowing spreads. Again, I’ve limited it to 1985-2014.
Fig. 3: Year over Year Change in Commercial Bank Interest Received and Paid, as a Share of Assets, and the Federal Funds Rates
Fig. 4: Year over Year Change in Commercial Bank Interest Received and Paid, as a Share of Assets
Both figures show that rising rates are associated with narrower commercial bank spreads — that is, less profitable loans, not more profitable. (Note the steeper slope of the red line than the blue one in Figure 3.) Again, this is not surprising — since banks borrow short and lend long, their average funding costs change more quickly than their average lending rates do. The most recent three tightening episodes were all associated with narrower spreads, not wider ones. Over 2004-2006, banks’ funding costs rose by 1.5 points while the average rate on their loans rose by only 1.3 points. In 1999-2000, funding costs rose by 0.55 points while loan rates rose by 0.45 points. And in 1994-1996, bank funding costs rose by 0.6 points while loan rates rose by 0.4 points. Conversely, during the period of falling rates in 2007-2008, bank funding costs fell by 1.7 points while average loan rates fell by only 1.4 points. Admittedly, these are all rather small changes — what is most striking about banking spreads is their stability. But the important thing is that past tightening episodes have consistently reduced the lending profits of commercial banks. Not increased them.
Thinking about the political economy of support for higher rates, as Krugman is doing, is asking the right question. And the idea that the narrow interests of commercial banks could be important here, is reasonable on its face. But the idea that higher rates are associated with higher lending spreads, just doesn’t seem to be supported by the data. Unfortunately, I don’t have a simple alternative story. As the late Bob Fitch used to say, 90 percent of what happens in the world can be explained by vulgar Marxism. But banks’ support for hard money may fall in the other 10 percent.
UPDATE: For what it’s worth, here are the results of regressions of average interest received by commercial banks and of and their average funding costs, on the Federal Funds rate. Both interest flows are normalized by total assets.
Full Period (1955-2014)
1955-1984
1985-2014
Coefficient
r2
Coefficient
r2
Coefficient
r2
Funding
0.51
0.77
0.56
0.85
0.61
0.92
(0.04)
(0.04)
(0.03)
Lending
0.54
0.69
0.61
0.85
0.67
0.89
(0.05)
(0.05)
(0.04)
Funding
0.30
0.67
0.22
0.60
0.42
0.86
(0.03)
(0.03)
(0.03)
Lending
0.30
0.67
0.25
0.63
0.39
0.79
(0.03)
(0.04)
(0.04)
Again, we don’t see any support for the hypothesis that spreads systematically rise with interest rates. Depending on the period and on whether you look at levels or changes, you can see a slightly stronger relationship of the Federal Funds rate with either bank lending rates of funding costs; but none of these differences would pass a standard significance test.
Two positive conclusions come out of this. First, all the coefficients are substantially, and significantly, below 1. In other words, the policy rate is passed through far from completely to market rates, even in the interbank market, which should be most closely linked to it. Second, looking at the bottom half of the table, we see that changes in the policy rate have a stronger affect on both the funding and lending rates (at least over a horizon of a year) today than they did in the postwar decades. This is not surprising, given the facts that non-interest-bearing deposits provided most bnk funding in the earlier period, and that monetary policy then worked through more limits on the quantity of credit than interest rates per se. But it’s interesting to see it so clearly in the data.
UPDATE 2: Krugman seems to be doubling down on the bank spreads theory. I hope he looks a bit at the historical data before committing too hard to this story.
VERY LATE UPDATE: In the table above, the first set of rows is levels; the second is year-over-year changes.
[1] This measure is not quite the same as the spread — for that, we would want to divide bank interest costs by their liabilities, or their interest-bearing liabilities, rather than their assets. But this measure, rather than the spread in the strict sense, is what’s relevant for the question we’re interested in, the effect of rate changes on bank lending profits. Insofar as bank loans are funded with equity, lending will become more profitable as rates rise, even if the spread is unchanged. For this reason, I refer to banks average funding costs, rather than average borrowing costs.
In a previous post, I pointed out that if capital means real investment, then the place where capital is going these days is fossil fuels, not the industries we usually think of as high tech. I want to build on that now by looking at some other financial flows across these same sectors.
As I discussed in the previous post, any analysis of investment and profits has to deal with the problem of R&D, and IP-related spending in general. If we want to be consistent with the national accounts and, arguably, economic theory, we should add R&D to investment, and therefore also to cashflow from operations. (It’s obvious why you have to do this, right?) But if we want to be consistent with the accounting principles followed by individual businesses, we must treat R&D as a current expense. For many purposes, it doesn’t end up making a big difference, but sometimes it does.
Below, I show the four major sources and uses of funds for three subsets of corporations. The flows are: cashflow from operations — that is, profits plus depreciation, plus R&D if that is counted in investment; profits; investment, possibly including R&D; and net borrowing. The universes are publicly traded corporations: first all of them; second the high tech sector, defined as in the previous post, and third fossil fuels, also as defined previously. Here I am using the broad measure of investment, including R&D, and the corresponding measure of cashflow from operations. At the end of the post, I show the same figures using the narrow measure of investment, and with profits as well as cashflow.
For the corporate sector as a whole, we have the familiar story. Over the past twenty-five years annual shareholder payouts (dividends plus share repurchases) have approximately doubled, rising from around 3 percent of sales in the 1950s, 60s and 70s to around 6 percent today. Payouts have also become more variable, with periods of high and low payouts corresponding with high and low borrowing. (This correlation between payouts and borrowing is also clearly visible across firms since the 1990s, but not previously, as discussed here.) There’s also a strong upward trend in cashflow from operations, especially in the last two expansions, rising from about 10 percent of sales in the 1970s to 15 percent today. Investment spending, however, shows no trend; since 1960, it’s stayed around 10 percent of sales. The result is an unprecedented gap between corporate earnings and and investment.
Here’s one way of looking at this. Recall that, if these were the only cashflows into and out of the corporate sector, then cash from operations plus net borrowing (the two sources) would have to equal investment plus payouts (the two uses). In the real world, of course, there are other important flows, including mergers and acquisitions, net acquisition of financial assets, and foreign investment flows. But there’s still a sense in which the upper gap in the figure is the mirror image or complement of the lower gap. The excess of cash from operations over investment shows that corporate sector’s real activities are a net source of cash, while the excess of payouts over borrowing suggests that its financial activities are a net use of cash.
Focusing on the relationship between cashflow and investment suggests a story with three periods rather than two. Between roughly 1950 and 1970, the corporate sector generated significantly more cash than it required for expansion, leaving a surplus to be paid out through the financial system in one form or another. (While payouts were low compared with today, borrowing was also quite low, leaving a substantial net flow to owners of financial assets.) Between 1970 and 1985 or so, the combination of higher investment and weaker cashflow meant that, in the aggregate all the funds generated within the corporate sector were being used there, with no net surplus available for financial claimants. This is the situation that provoked the “revolt of the rentiers.” Finally, from the 1990s and especially after 2000, we see the successful outcome of the revolt.
This is obviously a simplified and speculative story. It’s important to look at what’s going on across firms and not just at aggregates. It’s also important to look at various flows I’ve ignored here; cashflow ideally should be gross, rather than net, of interest and taxes, and those two flows along with net foreign investment, net acquisition of financial assets, and cash M&A spending, should be explicitly included. But this is a start.
Now, let’s see how things look in the tech sector. Compared with publicly-traded corporations as a whole, these are high-profit and high-invewtment industries. (At least when R&D is included in investment — without it, things look different.) It’s not surprising that high levels of these two flows would go together — firms with higher fixed costs will only be viable if they generate larger cashflows to cover them.
But what stands out in this picture is how the trends in the corporate sector as a whole are even more visible in the tech industries. The gap between cashflow and investment is always positive here, and it grows dramatically larger after 1990. In 2014, cashflow from operations averaged 30 percent of sales in these industries, and reported profits averaged 12 percent of sales — more than double the figures for publicly traded corporations as a whole. So to an even greater extent than corporations in general, the tech industries have increasingly been net sources of funds to the financial system, not net users of funds from it. Payouts in the tech industries have also increased even faster than for publicly traded corporations in general. Before 1985, shareholder payouts in the tech industries averaged 3.5 percent of sales, very close to the average for all corporations. But over the past decade, tech payouts have averaged full 10 percent of annual sales, compared with just a bit over 5 percent for publicly-traded corporations as a whole.
In 2014, there were 15 corporations listed on US stock markets with total shareholder payouts of $10 billion or more, as shown in the table below. Ten of the 15 were tech companies, by the definition used here. Computer hardware and software are often held out as industries in which US capitalism, with its garish inequality and fierce protections of property rights, is especially successful at fostering innovation. So it’s striking that the leading firms in these industries are not recipients of funds from financial markets, but instead pay the biggest tributes to the lords of finance.
Dividends
Repurchases
Total Payouts
APPLE INC
11,215
45,000
56,215
EXXON MOBIL CORP
11,568
13,183
24,751
IBM
4,265
13,679
17,944
INTEL CORP
4,409
10,792
15,201
ROYAL DUTCH SHELL PLC
11,843
3,328
15,171
JOHNSON & JOHNSON
7,768
7,124
14,892
NOVARTIS AG
6,810
6,915
13,725
CISCO SYSTEMS INC
3,758
9,843
13,601
MERCK & CO
5,156
7,703
12,859
CHEVRON CORP
7,928
4,412
12,340
PFIZER INC
6,691
5,000
11,691
AT&T INC
9,629
1,617
11,246
BP PLC
5,852
4,589
10,441
ORACLE CORP
2,255
8,087
10,342
GENERAL ELECTRIC CO
8,949
1,218
10,167
2014. Values in millions of dollars. Tech firms in bold.
It’s hard to argue that Apple and Merck represent mature industries without significant growth prospects. And note that, apart from GE (which is not listed in the the high-tech sector as defined here, but perhaps should be), all the other members of the $10 billion club are in the fast-growing oil industry. It’s hard to shake the feeling that what distinguishes high-payout corporations is not the absence of investment opportunities, but rather the presence of large monopoly rents.
Finally, let’s quickly look at the fossil-fuel industries. Up through the 1980s, the picture here is not too different from publicly-traded corporations in general, though with more variability — the collapse in fossil-fuel earnings and dividends in the 1970s is especially striking. But it’s interesting that, despite very high payouts in several big oil companies, there has been no increase in payouts for the sector in general. And in the most recent oil and gas boom, new investment has been running ahead of internal cashflow, making the sector a net recipient of funds from financial markets. (This trend seems to have intensified recently, as falling profits in the sector have not (yet) been accompanied with falling investment.) So the capital-reallocation story has some prima facie plausibility as applied to the oil and gas boom.
In the next, and final, post in this series, I’ll try to explain why I don’t think it makes sense to think of shareholder payouts as a form of capital reallocation. My argument has two parts. First, I think these claims often rest on an implicit loanable-funds framework that is logically flawed. There is not a fixed stock of savings available for investment; rather, changes in investment result in changes in income that necessarily produce the required (dis)saving. So if payouts in one company boost investment in another, it cannot be by releasing real resources, but only by relieving liquidity constraints. And that’s the second part of my argument: While it is possible for higher payouts to result in greater liquidity, it is hard to see any plausible liquidity channel by which more than a small fraction of today’s payouts could be translated into higher investment elsewhere.
Finally, here are the same graphs as above but with investment counted as it is businesses’ own financial statements, with R&D spending counted as current costs. The most notable difference is the strong downward trend in tech-sector investment when R&D is excluded.
Readers of this blog are familiar with the “short-termism” position: Because of the rise in shareholder power, the marginal use of funds for many corporations is no longer fixed investment, but increased payouts in the form of dividends and sharebuybacks. We’re already seeing some backlash against this view; I expect we’ll be seeing lots more.
The claim on the other side is that increased payouts from established corporations are nothing to worry about, because they increase the funds available to newer firms and sectors. We are trying to explore the evidence on this empirically. In a previous post, I asked if the shareholder revolution had been followed by an increase in the share of smaller, newer firms. I concluded that it didn’t look like it. Now, in this post and the following one, we’ll look at things by industry.
In that earlier post, I focused on publicly traded corporations. I know some people don’t like this — new companies, after all, aren’t going to be publicly traded. Of course in an ideal world we would not limit this kind of analysis to public traded firms. But for the moment, this is where the data is; by their nature, publicly traded corporations are much more transparent than other kinds of businesses, so for a lot of questions that’s where you have to go. (Maybe one day I’ll get funding to purchase access to firm-level financial data for nontraded firms; but even then I doubt it would be possible to do the sort of historical analysis I’m interested in.) Anyway, it seems unlikely that the behavior of privately held corporations is radically different from publicly traded one; I have a hard time imagining a set of institutions that reliably channel funds to smaller, newer firms but stop working entirely as soon as they are listed on a stock market. And I’m getting a bit impatient with people who seem to use the possibility that things might look totally different in the part of the economy that’s hard to see, as an excuse for ignoring what’s happening in the parts we do see.
Besides, the magnitudes don’t work. Publicly traded corporations continue to account for the bulk of economic activity in the US. For example, we can compare the total assets of the nonfinancial corporate sector, including closely held corporations, with the total assets of publicly traded firms listed in the Compustat database. Over the past decade, the latter number is consistently around 90 percent of the former. Other comparisons will give somewhat different values, but no matter how you measure, the majority of corporations in the US are going to be publicly traded. Anyway, for better or worse, I’m again looking at publicly-traded firms here.
In the simplest version of the capital-reallocation story, payouts from old, declining industries are, thanks to the magic of the capital markets, used to fund investment in new, technology-intensive industries. So the obvious question is, has there in fact been a shift in investment from the old smokestack industries to the newer high-tech ones?
One problem is defining investment. The accounting rules followed by American businesses generally allow an expense to be capitalized only when it is associated with a tangible asset. R&D spending, in particular, must be treated as a current cost. The BEA, however, has since 2013 treated R&D spending, along with other forms of intellectual property production, as a form of investment. R&D does have investment-like properties; arguably it’s the most relevant form of investment for some technology-intensive sectors. But the problem with redefining investment this way is that it creates inconsistencies with the data reported by individual companies, and with other aggregate data. For one thing, if R&D is capitalized rather than expensed, then profits have to be increased by the same amount. And then some assumptions have to be made about the depreciation rate of intellectual property, resulting in a pseudo asset in the aggregate statistics that is not reported on any company’s books. I’m not sure what the best solution is. [1]
Fortunately, companies do report R&D as a separate component of expenses, so it is possible to use either definition of investment with firm-level data from Compustat. The following figure shows the share of total corporate investment, under each definition, of a group of six high-tech industries: drugs; computers; communications equipment; medical equipment; scientific equipment other electronic goods; and software and data processing. [2]
As you can see, R&D spending is very important for these industries; for the past 20 years, it has consistently exceed investment spending as traditionally defined. Using the older, narrow definition, these industries account for no greater share of investment in the US than they did 50 years ago; with R&D included, their share of total investment has more than doubled. But both measures show the high-tech share of investment peaking in the late 1990s; for the past 15 years, it has steadily declined.
Obviously, this doesn’t tell us anything about why investment has stalled in these industries since the end of the tech boom. But it does at least suggest some problems with a simple story in which financial markets reallocate capital from old industries to newer ones.
The next figure breaks out the industries within the high-tech group. Here we’re looking at the broad measure of investment, which incudes R&D.
As you can see, the decline in high-tech investment is consistent across the high-tech sectors. While the exact timing varies, in the 1980s and 1990s all of these sectors saw a rising share of investment; in the past 15 years, none have. [3] So we can safely say: In the universe of publicly traded corporations, the sectors we think would benefit from reallocation of capital were indeed investing heavily in the decades before 2000; but since then, they have not been. The decline in investment spending in the pharmaceutical industry — which, again, includes R&D spending on new drugs — is especially striking.
Where has investment been growing, then? Here:
The red lines show broad and narrow investment for oil and gas and related industries — SICs 101-138, 291-299, and 492. Either way you measure investment, the increase over the past 15 years has dwarfed that in any other industry. Note that oil and gas, unlike the high-tech industries, is less R&D-intensive than the corporate sector as a whole. Looking only at plant and equipment, fossil fuels account for 40 percent of total corporate investment; by this measure, in some recent years, investment here has exceeded that of all manufacturing together. With R&D included, by contrast, fossil fuels account for “only” a third of US investment.
In the next post, I’ll look at the other key financial flows — cashflow from operations, shareholder payouts, and borrowing — for the tech industries, compared with corporations in general. As we’ll see, while at one point payouts were lower in these industries than elsewhere, over the past 15 years they have increased even faster than for publicly traded corporations as a whole. In the meantime:
Very few of the people talking about the dynamic way American financial markets reallocate capital have, I suspect, a clear idea of the actual reallocation that is taking place. Save for another time the question of whether this huge growth in fossil fuel extraction is a good thing for the United States or the world. (Spoiler: It’s very bad.) I think it’s hard to argue with a straight face that shareholder payouts at Apple or GE are what’s funding fracking in North Dakota.
[1] This seems to be part of a larger phenomenon of the official statistical agencies being pulled into the orbit of economic theory and away from business accounting practices. It seems to me that allowing the official statistics to drift away from the statistics actually used by households and businesses creates all kinds of problems.
[2] Specifically, it is SICs 83, 357, 366, 367, 382, 384, and 737. I took this specific definition from Brown, Fazzari and Petersen. It seems to be standard in the literature.
[3] Since you are probably wondering: About two-thirds of that spike in software investment around 1970 is IBM, with Xerox and Unisys accounting for most of the rest.
Are shareholder payouts a tool for reallocating capital from large, established corporations to the newer, smaller firms with better prospects for growth? If so, we should see this reflected in the investment figures — the shareholder revolution of the 1980s, and the more recent growth of activist investors, should be associated with a shift of investment away from big incumbent firms. Do we see this?
As a simple test, we can look at the share of corporate investment accounted for by smaller and younger firms. And the answer this exercise suggests is, No. Within the corporate sector, there is also no sign of capital being allocated to new sectors and smaller firms. The following figures show the share of total corporate investment accounted for by young firms, defined as those listed for less than five years; and by small firms, defined as those with sales below the median sales for listed corporations in that year. [1]
The share of investment accounted for newer firms fluctuates between 5 and 20 percent of the total, peaking periodically when large numbers of new firms enter the markets. [2] The most recent such peak came in tech boom period of the late 1990s, as one might expect. But the young-firm investment share shows no upward trend, and since the recession has been stuck at its lowest level of the postwar period. As for the the share of investment accounted for small firms, it has steadily declined since the 1950s — apart from, again, a temporary spike during the tech-boom period. Like the investment share of newer firms, the investment share of small firms is now at its lowest level ever.
We come to a similar conclusion if we look at the share of investment accounted for by noncorporate businesses. Partnerships, sole proprietorships and other noncorporate businesses accounted for close to 20 percent of US fixed investment in the 1960s and 1970s, but have accounted for a steady 12 percent of fixed investment over the past 25 years. So the funds flowing out of large corporations sector are not financing increased investment in smaller, younger corporations, or in the noncorporate sector either.
This is not really surprising. Smaller and younger businesses are mainly dependent on bank loans, and shareholder payouts don’t increase bank lending capacity in any direct way. More broadly, it’s hard to see evidence that potential funders of new businesses are liquidity-constrained. Higher payouts presumably do contribute to higher stock prices, and perhaps marginally to lower bond yields, but any connection with financing for new businesses seems tenuous at best.
In any case, whatever the shareholder revolution has accomplished, there does no seem to have been any reallocation of capital to smaller, growing firms. Capital accumulation in the United States is more concentrated in large established corporations than ever.
[1] Data is from Compustat, a database that assembles all the income, cashflow and balance sheet statements published since 1950 by corporations listed on US markets. I’ve excluded the financial sector, defined as 2-digit NAICS 52 and 53 and SIC 60-69. Investment is capital expenditure plus R&D.
[2] I suspect the late-80s peak is an artifact of the many changes of ownership in that period, which are hard to distinguish from new listings.
… or at least don’t blame him for increased federal debt.
Arjun and I have been working lately on a paper on monetary and fiscal policy. (You can find the current version here.) The idea, which began with someposts on my blog last year, is that you have to think of the output gap and the change in the debt-GDP ratio as jointly determined by the fiscal balance and the policy interest rate. It makes no sense to talk about the “natural” (i.e. full-employment) rate of interest, or “sustainable” (i.e. constant debt ratio) levels of government spending and taxes. Both outcomes depend equally on both policy instruments. This helps, I think, to clarify some of the debates between orthodoxy and proponents of functional finance. Functional finance and sound finance aren’t different theories about how the economy works, they’re different preferred instrument assignments.
We started working on the paper with the idea of clarifying these issues in a general way. But it turns out that this framework is also useful for thinking about macroeconomic history. One interesting thing I discovered working on it is that, despite what we all think we know, the increase in federal borrowing during the 1980s was mostly due to higher interest rate, not tax and spending decisions. Add to the Volcker rate hikes the deep recession of the early 1980s and the disinflation later in the decade, and you’ve explained the entire rise in the debt-GDP ratio under Reagan. What’s funny is that this is a straightforward matter of historical fact and yet nobody seems to be aware of it.
Here, first, are the overall and primary budget balances for the federal government since 1960. The primary budget balance is simply the balance excluding interest payments — that is, current revenue minus . non-interest expenditure. The balances are shown in percent of GDP, with surpluses as positive values and deficits as negative. The vertical black lines are drawn at calendar years 1981 and 1990, marking the last pre-Reagan and first post-Reagan budgets.
The black line shows the familiar story. The federal government ran small budget deficits through the 1960s and 1970s, averaging a bit more than 0.5 percent of GDP. Then during the 1980s the deficits ballooned, to close to 5 percent of GDP during Reagan’s eight years — comparable to the highest value ever reached in the previous decades. After a brief period of renewed deficits under Bush in the early 1990s, the budget moved to surplus under Clinton in the later 1990s, back to moderate deficits under George W. Bush in the 2000s, and then to very large deficits in the Great Recession.
The red line, showing the primary deficit, mostly behaves similarly to the black one — but not in the 1980s. True, the primary balance shows a large deficit in 1984, but there is no sustained movement toward deficit. While the overall deficit was about 4.5 points higher under Reagan compared with the average of the 1960s and 1970s, the primary deficit was only 1.4 points higher. So over two-thirds of the increase in deficits was higher interest spending. For that, we can blame Paul Volcker (a Carter appointee), not Ronald Reagan.
Volcker’s interest rate hikes were, of course, justified by the need to reduce inflation, which was eventually achieved. Without debating the legitimacy of this as a policy goal, it’s important to keep in mind that lower inflation (plus the reduced growth that brings it about) mechanically raises the debt-GDP ratio, by reducing its denominator. The federal debt ratio rose faster in the 1980s than in the 1970s, in part, because inflation was no longer eroding it to the same extent.
To see the relative importance of higher interest rates, slower inflation and growth, and tax and spending decisions, the next figure presents three counterfactual debt-GDP trajectories, along with the actual historical trajectory. In the first counterfactual, shown in blue, we assume that nominal interest rates were fixed at their 1961-1981 average level. In the second counterfactual, in green, we assume that nominal GDP growth was fixed at its 1961-1981 average. And in the third, red, we assume both are fixed. In all three scenarios, current taxes and spending (the primary balance) follow their actual historical path.
In the real world, the debt ratio rose from 24.5 percent in the last pre-Reagan year to 39 percent in the first post-Reagan year. In counterfactual 1, with nominal interest rates held constant, the increase is from 24.5 percent to 28 percent. So again, the large majority of the Reagan-era increase in the debt-GDP ratio is the result of higher interest rates. In counterfactual 2, with nominal growth held constant, the increase is to 34.5 percent — closer to the historical level (inflation was still quite high in the early ’80s) but still noticeably less. In counterfactual 3, with interest rates, inflation and real growth rates fixed at their 1960s-1970s average, federal debt at the end of the Reagan era is 24.5 percent — exactly the same as when he entered office. High interest rates and disinflation explain the entire increase in the federal debt-GDP ratio in the 1980s; military spending and tax cuts played no role.
After 1989, the counterfactual trajectories continue to drift downward relative to the actual one. Interest on federal debt has been somewhat higher, and nominal growth rates somewhat lower, than in the 1960s and 1970s. Indeed, the tax and spending policies actually followed would have resulted in the complete elimination of the federal debt by 2001 if the previous i < g regime had persisted. But after the 1980s, the medium-term changes in the debt ratio were largely driven by shifts in the primary balance. Only in the 1980s was a large change in the debt ratio driven entirely by changes in interest and nominal growth rates.
So why do we care? (A question you should always ask.) Three reasons:
First, the facts themselves are interesting. If something everyone thinks they know — Reagan’s budgets blew up the federal debt in the 1980s — turns out not be true, it’s worth pointing out. Especially if you thought you knew it too.
Second is a theoretical concern which may not seem urgent to most readers of this blog but is very important to me. The particular flybottle I want to find the way out of is the idea that money is neutral, veil — that monetary quantities are necessarily, or anyway in practice, just reflections of “real” quantities, of the production, exchange and consumption of tangible goods and services. I am convinced that to understand our monetary production economy, we have to first understand the system of money incomes and payments, of assets and liabilities, as logically self-contained. Only then we can see how that system articulates with the concrete activity of social production. [1] This is a perfect example of why this “money view” is necessary. It’s tempting, it’s natural, to think of a money value like the federal debt in terms of the “real” activities of the federal government, spending and taxing; but it just doesn’t fit the facts.
Third, and perhaps most urgent: If high interest rates and disinflation drove the rise in the federal debt ratio in the 1980s, it could happen again. In the current debates about when the Fed will achieve liftoff, one of the arguments for higher rates is the danger that low rates lead to excessive debt growth. It’s important to understand that, historically, the relationship is just the opposite. By increasing the debt service burden of existing debt (and perhaps also by decreasing nominal incomes), high interest rates have been among the main drivers of rising debt, both public and private. A concern about rising debt burdens is an argument for hiking later, not sooner. People like Dean Baker and Jamie Galbraith have pointed out — correctly — that projections of rising federal debt in the future hinge critically on projections of rising interest rates. But they haven’t, as far as I know, said that it’s not just hypothetical. There’s a precedent.
[1] Or in other words, I want to pick up from the closing sentence of Doug Henwood’s Wall Street, which describes the book as part of “a project aiming to end the rule of money, whose tyranny is sometimes a little hard to see.” We can’t end the rule of money until we see it, and we can’t see it until we understand it as something distinct from productive activity or social life in general.
I want to amplify the last point from the previous post, about anti-financialization.
If we go back to the beginning of the national accounts in 1929, we find personal consumption accounts for around 75% of GDP. (This is true whether or not we make the C&F adjustments, since in 1929 the imputed and third-party component of consumption were either nonexistent or small.) During the Depression, the consumption share rises to 85% as business investment collapses, during the war it falls to below 50%, and it rises back to around two-thirds after 1945. It’s in the second half of the 1940s, with the growth of pension and health benefits and the spread of homeownership, that we start to see a large wedge between headline consumption and actual cash expenditures by households.
We can think of the ratio of adjusted consumption to GDP as a measure of how marketized the economy is: How much of output is purchased by people for their own use, as opposed to allocated in some other way? In this sense, the steady fall in adjusted consumption as a share of GDP represents a steady retreat of capitalist production in the postwar US. It was squeezed from both sides: from “above” by public provision of health care, education and retirement security, and from “below” by the state-fostered growth of self-provision in housing.
Consumption spending by households bottomed out at 47 percent of GDP in 1981. With the neoliberal turn, the process of de-marketization largely halted — but it did not reverse. Since then, consumption spending by households has hovered around 47-48% of GDP. The phenomena of household financialization, “markets for everything,” etc. are real — but only at the level of ideology. Private life in the US has not become more commodified, marketized or financialized in recent decades; over a longer horizon the opposite. What has happened is that a thickening veneer of fictional market transactions has been overlaid on a reality of social consumption.
In reality, neither collective provision of health care (or of education, public safety, etc.) nor self-provision of housing has been replaced to any noticeable degree by market purchases. What we’ve had, instead, is the statistical illusion of rising private consumption spending — an illusion fostered by the distortion of the national accounts by the dominant economic theory. When health insurance is purchased collectively by government or employers, the national accounts pretend that people were paid in cash and then chose to purchase health coverage individually. When retirement savings are carried out collectively by government or employers, the national accounts pretend that people were paid in cash and then chose to purchase financial assets. When people buy houses for their own use, the national accounts pretend they are profit-maximizing landlords, selling the use of their houses in the rental market. When liquidity constraints force people to hold financial wealth in low-yield forms, the national accounts pretend that financial markets are frictionless and that they are receiving the market yield in some invisible form. Together, these fictional transactions now make up 20 percent of GDP, and fully a third of apparent household consumption.
Of course, that might change. The decline of homeownership and the creation of a rental market for single-family homes may turn the fiction of a housing sector of tenants and profit-seeking landlords into a reality. One result of Obamacare — intended or otherwise — will be to replace collective purchases of health insurance by employers with individual purchases by households. Maybe the Kochs and Mark Zuckerberg will join forces and succeed in privatizing the schools. But none of that has happened yet. What’s striking to me is how many critics of contemporary capitalism — including Cynamon and Fazzari themselves — have accepted the myth of rising household consumption, without realizing there’s no such thing. The post 1980s rise in consumption is a statistical artifact of the ideology of capitalism — a way of pretending that a world of collective production and consumption is a world of private market exchange.


