A History of Debt/GDP

“Probably more uninformed statements have been made on public-sector debt and deficits,” says Willem Buiter, “than on any other subject in macroeconomics. Proof by repeated assertion has frequently appeared to be an acceptable substitute for proof by deduction or proof by induction.”

It’s hard to disagree. 
But at least we know where an informed discussion starts. It starts from the least controversial equation of macroeconomics, the law of motion of public debt:
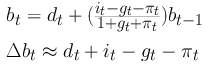
b is the ratio of public debt to GDP, d is the ratio of primary deficit to GDP, i is the nominal interest rate, g is the real growth rate of GDP, and pi is inflation. In principle this is true by definition. (In practice things aren’t alway so simple.) The first thing you realize, looking at this equation, is that contrary to the slack-jawed bleating of conventional opinion, there’s no necessary connection between the evolution of public debt and government spending and taxes. Interest rates, growth rates and inflation are, in principle, just as important as the primary balance. Which naturally invites the question, which have been more important in practice?
There have been various efforts to answer this question for different countries in different periods, but until recently there wasn’t any systematic effort to answer it for a broad sample of countries over a long period. I was thinking of trying to do such an exercise myself. But it looks like that’s not necessary. As Tom M. points out in comments,  the IMF has just undertaken such an exercise. Using the new Historical Public Debt Database, they’ve decomposed the debt-GDP ratios of 174 countries, from 1880 to the present, into the four components of the law of motion. (Plus a fifth, discussed below.) It’s an impressive project. Ands far as one can tell from this brief presentation, they did it right. Admittedly it’s a laconic 25-page powerpoint, but there’s not even the hint of a suggestion that microfoundations or welfare analysis would contribute anything. The question is just, how much has each of the components contributed to shifts in debt-GDP ratios historically?
As I’ve noted here before, the critical issue is the relationship between g and i, or (g + pi) and i as I’ve written it here. On this point, the IMF study gives ammunition to both sides.
From roughly 1895 to 1920, and from 1935 to 1980, nominal growth rates (g + pi) generally exceeded nominal interest rates. From 1880 to 1895, from 1920 to 1935, and from 1980 to the present, interest mostly exceeded growth. It’s impossible, looking at this picture, to say one relationship or the other is normal. Lernerian-Keynesians will say, why can’t the conditions of the postwar decades be reproduced by any government that chooses to; while the orthodox (Marxists and neoclassicals equally) will say the postwar decades were anomalous for various reasons — financial repression, limited international mobility of capital, exceptionally strong growth. The historical evidence doesn’t clearly resolve the question either way.

Given the unstable relationship between g and i, it’s not surprising there’s no consistent pattern in episodes of long-term reduction in debt-GDP ratios. I had hoped such episodes would turn out to be always, or almost always, the result of faster growth, lower interest rates, and higher inflation. This is basically true for the postwar decades, when the biggest debt reductions happened. Since 1980, though, it seems that countries that have reduced their debt-GDP ratios have done it the hard way, by taxing more than they spent. Over the whole period since 1880, periods of major (at least 10 percent of GDP) debt reduction has involved primary surpluses and g > r in about equal measure.

Another interesting point is how much the law of motion turns out to have exceptions. The IMF’s version of the equation above includes an additional term on the right side: SFA, or stock-flow adjustment, meaning the discrepancy between the flow of debt implied by the other terms of the equation and the stock of debt actually observed. This discrepancy turns out to be often quite large. This could reflect a lot of factors; but for recent episodes of rising debt-GDP ratios (in which SFA seems to play a central role) the obvious interpretation is that it reflects the assumption by the government of the banking system’s debts, which is often not reflected in official deficit statistics but may be large relative to the stock of debt. The extreme case is Ireland, where the government guarantee of the financial system resulted in the government assuming bank liabilities equal to 45 percent of GDP. To the extent this is an important factor in rising public debt generally — and again, the IMF study supports it — it suggests another reason why concern with balancing the long-term budget by “reforming” Medicare, etc., is misplaced. One financial crisis can cancel out decades of fiscal rectitude; so if you’re concerned about what the debt-GDP ratio will be in 2075, you should spend less time thinking about public spending and taxes, and much more time thinking about effective regulation of the financial sector.
The bottom line is, the dynamics of public debt are complicated. But as always, intractable theoretical controversies become more manageable, or at least more meaningful, when they’re posed as concrete historical questions. Good on the IMF for doing this.

We Are All Austerians Now

Mark Thoma:

we must cut spending and raise taxes to get the debt under control

I’m sorry, but This. Is. Not. True.

If you look at future debt-GDP ratios and think they are too high, how can you reduce them?

1. You can improve the primary balance by raising taxes and/or reducing spending.

2. You can raise the growth rate.

3. You can lower the real interest rate on government debt.

4. You can raise inflation. (This may also help with 3, depending what we think of Fisher’s law.)

EDIT: 5. You can default. (Thanks, Bruce Wilder.)

One is not the only choice. We can, of course, debate which of these choices offers the best tradeoff between feasibility and desirability. But it is not true that reducing the long-run debt-GDP ratio necessarily involves reducing spending or raising taxes. And anyone who want a rational discussion of fiscal issues, needs to stop lying to people that it is.

How bad things are, can be seen by the fact that someone as smart as Barkely Rosser has been convinced that a reluctance to raise taxes is the problem for aggregate demand. When the debate comes down or whether we should raise taxes or cut spending, the real question has been answered, and answered wrong. At that point it’s just a question of what flavor of austerity we want. Thank god at least there’s still Daniel Davis.

If we wanted to move this debate forward, the next step would be to look at periods when the long term debt-GDP ratio was reduced in rich countries. How much was due to the primary balance that Thoma takes for granted is the only solution, how much was due to faster growth, how much to lower interst rates and how much to higher inflation?

It’s Not About the Deficits

I was going to write something about tonight’s debt-celing deal. “Reduces Domestic Discretionary Spending to the Lowest Level Since Eisenhower,” says the White House in triumphant title case. Yay! No more EPA, no more civil rights enforcement, no more federal spending on housing or child care or clean energy. They didn’t need them in the Eisenhower era, so why should we?

It makes me mad. And it’s not good to write when you’re mad. As the man says,

Hatred, even of baseness,
Distorts the features.
Anger, even against injustice,
Makes the voice grow hoarse.

So instead of this appalling deal, let’s talk about the trajectory of the debt historically. Specifically, this very interesting take from the always-interesting Willem Buiter:

The last time the US sovereign radically lowered the ratio of public debt to GDP was between 1946 (the all-time high for the Federal debt burden at 121.20 percent) and 1974 (its post-World War II low at 31.67 percent). Arithmetically, of the 89.53 percentage points reduction in the Federal debt burden, inflation accounted for 52.63pp and real GDP growth accounted for 55.86 pp. Federal surpluses accounted for minus 20.51pp.

Longer average maturity and occasionally sharp bursts of inflation helped erode the real burden of the Federal debt between 1946 and 1974, but so did financial repression – ceilings on nominal interest rates. … Until the Treasury-Federal Reserve Accord of March 1951, the Federal Reserve System was formally committed to maintaining a low interest rate peg on Treasury bonds – a practice introduced in 1942 when the Fed pegged the interest rate on Treasury bills at 0.375 percent. This practice was continued after the war despite a 14 percent rate of CPI inflation in 1947 and an 8 percent rate in 1948. The rate on 3-month Treasury Bills remained at 0.375 percent until June 1947 and did not reach 1.40 percent until March 1951.

Even after the Treasury-Federal Reserve Accord, there remained financial repression in the form of ceilings on bank lending and borrowing rates like Regulation Q, which prohibited the payment of interest on demand deposits. Without financial repression and with a relatively short average debt maturity, it would take high US rates of (unanticipated) inflation to bring down the burden of the debt appreciably.

This is the key point that comes out of the relationships that govern the evolution of the federal debt: Deficits/surpluses are just one factor, along with growth rates, interest rates, and inflation, that determine the trajectory of the debt. There’s no a priori reason to think that long-term shifts in the debt-GDP ratio are more likely to come about through changes in the government’s fiscal stance rather than one of the other three variables; and there’s historical evidence that in practice growth, inflation and interest rates usually matter more. At some point I’ll do an exercise similar to Buiter’s. But in the meantime, I’m happy to take it from him — the dude is the chief economist at Citibank — that, in the the postwar decades, growth and inflation contributed about equally to the very large reduction in the US debt-GDP ratio, while fiscal discipline contributed less than nothing.

So if you wanted to follow the postwar US in reducing the debt-GDP ratio over a long period — it’s not entirely clear why you would want to do this — you should be thinking about faster growth, higher inflation and policies to hold down interest rates (aka “financial repression”), not higher taxes and lower spending. Anyone who says, “The growth of the debt is unsustainable, therefore we need to move the federal budget toward balance” doesn’t know what they’re talking about.

Or, they’re talking about something else.

You can interpret Obama’s relentless pursuit of defeat in the budget-ceiling fight in psychological terms. But it seems more parsimonious to at least consider that he’s simply an honest servant of the country’s owners, who see the crisis as a once-in-a-lifetime chance to roll back the social wage. Raising the Medicare eligibility age wouldn’t have done anything much to reduce the long-term debt-GDP ratio. But it definitely would reduce the number of people with Medicare.

UPDATE: This post is evidently the kind of thing Matt Yglesias has in mind when he says he’s

frustrated by lefties who seem to see the unprecedented Republican obstruction the President is dealing with as part of an 11-dimensional chess game through which Obama “really” wants his progressive initiatives to be frustrated at every term. 

 But this gets the n-dimensional chess metaphor backward, I think. The whole reason people claim Obama is playing a deeper or more complex game is to argue that even when his actions don’t seem to get him closer to his supposed goals, he really is getting there but by some devious route. But if your theory, as here, is that the actual outcome was the intended outcome, you don’t need to assume any deviousness. If I sacrifice my knight for no apparent gain, then maybe I have some complex plan you don’t see — that’s the extra dimensions. But if I’m playing to lose, no extra dimensions are needed to explain my bad move. Yglesias’s frustration here would apply to lefties who argued that Obama’s big progressive victories were really serving a conservative agenda. And there are certainly people who would argue that — if there were any big progressive victories to argue about.

Fiscal Arithmetic: The Blanchard Rule

When we left off, we’d concluded that the relationship between g, the growth rate of GDP, and i, the after-tax interest rate on government debt, was central to the evolution of public debt. When g > i, any primary deficit is sustainable, in the sense that the debt-GDP ratio converges to a finite value; when i > g, no primary deficit is sustainable, and a primary surplus, while formally sustainable at a certain exact value, occupies a knife-edge. Which invites the natural question, so which is bigger, usually?

There are articles that discuss this (tho not as many as you might think). Here’s a good recent article by Jamie Galbraith; I also like this one by Tony Aspromourgos, and “The Intertemporal Budget Constraint and the Sustainability of Budget Deficits” by Arestis and Sawyer. (I’m sorry, I can’t find a version of it online). An earlier and more mainstream, but for our current purposes especially interesting, take is this piece by Olivier Blanchard.  Blanchard says:

If i g were negative, the government would no longer need to generate primary surpluses to achieve sustainability. … The government could even run permanent primary deficits of any size, and these would eventually lead to a positive but constant level of debt… Theory suggests that this case, which corresponds to what is known as ‘dynamic inefficiency’, cannot be excluded, and that in such a case, a government should, on welfare grounds, probably issue more debt until the pressure on interest rates made them at least equal to the growth rate.

So much depends on whether the growth rate exceeds the interest rate, or not. Well, so, does it?

The funny thing about this passage in context is that Blanchard acknowledges that over most of the postwar period, the growth rate has exceeded the interest rate. But, he says, the professional consensus is that interest rates ought to equal or exceed growth rates, so he’ll stick with that assumption for the rest of the article. (There’s almost a genre of economics articles that freely admit a key assumption doesn’t seem to be consistently satisfied in practice, but then blithely go on assuming it. The Marshall-Lerner-Robinson condition is a favorite in this vein.) But we’re not here to mock; we’re here to call the Blanchard rule, the prescription that if i < g, the federal deficit ought to be higher.

Below are graphs of the growth rate and after-tax 10-year government bond rate for 10 OECD countries. Both are deflated by the CPI; the tax rate is the ratio of central government taxes to GDP. This is probably a bit high, but on the other hand the average maturity of government debt is less than 10 years in many OECD countries — in the US it is currently around 4.7 years — so these two biases might more or less cancel each other out, leaving the red line close to the economically relevant interest rate. Source is the OECD statistics site. I’ve excluded 2008-2010 since the Great Recession pulls growth rates sharply down in a (let’s hope!) misleading way. The lighter black line is the growth trend.

Click them to make them bigger!

Clearly we can’t exclude the relevance of the Blanchard rule; for much of the time, for many rich countries, the growth rate of GDP has exceeded the 10-year interest rate. At other times, interest has exceeded growth. What we see in most cases is a fairly stable growth rate, combined with an interest rate that jumps sharply up around 1980 and then drifts downward from somewhere in the 1990s. At some point soon, I hope, I’ll produce decompositions of the change in the fiscal position into the interest rate, the growth rate, changes in taxes and expenditure induced by the growth rate, and autonomous changes in taxes and spending. I suspect the first will be the most important, and the last the least. But in the meantime, we can say just looking at these graphs that changing interest rates are an important component of fiscal dynamics, so it’s wrong to think just in terms of the primary balance.

Which suggests — coming back to the earlier debate with John Quiggin — that if we are concerned with the long-term fiscal position, we should spend at least as much time worrying about policies that affect the interest rate on government debt relative to the growth rate, as we should about taxes relative to expenditures. And we should not assume a priori that a primary deficit is unsustainable.

Some Fiscal Arithmetic

If we’re going to discuss fiscal policy, we should be clear on the accounting relationships involved. So, here are some basic equations describing how the public debt evolves over time. I should say up front that the relationships I’m describing here, while they suggest an unorthodox skepticism about worries about debt “sustainability,” are themselves totally orthodox and noncontroversial. And they don’t make any behavioral assumptions — they’re true by definition.

We’re interested in the ratio of debt to GDP. What will this be at some time t?

Well, it will be equal to the ratio in the previous period, increased by rate of interest, and decreased by the rate of growth of GDP, (remember, we are talking about the debt-GDP ratio; increasing the denominator makes a fraction smaller), plus the previous period’s primary deficit, that is, the difference between spending on everything besides interest, and revenues.

Let b be the government debt and d the primary deficit (i.e. the deficit exclusive of interest payments), both as shares of GDP. Let i be the after-tax interest rate on government borrowing and g the growth rate of GDP (both real or both nominal, it doesn’t matter). Then we can rewrite the paragraph above as:

We can rearrange this to see how the debt changes from one period to the next:

Now, what happens if a given primary deficit is maintained for a long time? Does the debt-GDP ratio converge to some stable level? We can answer this question by setting the left-hand side of the above equation to zero. That gives us:

What does this mean? There are three cases to consider. If the rate of GDP growth is equal to the interest on government debt net of taxes, then the only stable primary balance is zero; any level of primary deficit leads to the debt-GDP rate rising without limit as long as its maintained. (And similarly, any level of primary surpluses leads to the government eventually paying off its debt accumulating a positive net asset position that grows without limit.) If g > i, then for any level of primary deficit, there is a corresponding stable level of debt; in this sense, there is no such thing as an “unsustainable” deficit. On the other hand, if g < i, then assuming debt is positive — a constant debt requires a primary surplus.

There is a further difference between the cases. When g > i, the equilibrium is stable; if for whatever reason the debt rises or falls above the level implied by the long-run average primary deficit, it will move back toward that level over time. But when g < i, if the debt is one dollar too high, it will rise without limit; if it is one dollar too low, it will fall without limit, to be eventually replaced by an endlessly growing positive net asset position.

So, which of these three cases is most realistic? Good question! So good, in fact, I’m going to devote a whole nother post to it. The short answer: sometimes one, sometimes another. But in the US, GDP growth has exceeded pre-tax interest on 5-year Treasuries (the average maturity of US debt is around 5 years) in about 50 of the past 60 years.

The discussion up to now has been in terms of the primary balance. But nearly all public discussions of fiscal issues focus on the total deficit, which includes interest along with other categories of spending. We can rewrite the equations above in those terms, adding a superscript T to indicate we’re talking about the total deficit. In these equations, g is the nominal growth rate of GDP.

Again, we define equilibrium as a situation in which the debt-GDP ratio is constant. Then we have:

In other words, any total deficit converges to a finite debt-GDP ratio. (And for every debt-GDP ratio, there is a total deficit that holds it stable.) So defining a sustainable total deficit requires picking a target debt-GDP ratio. Let’s say we expect nominal GDP growth to average 5% in the future. (That’s a bit low by historical standards, but it’s what the CBO assumes in its long-run budget forecasts.) Then 2010’s deficit of 8.8% of GDP implies a long-run debt-GDP ratio of about 175% — a number toward the top of the range observed historically in developed countries. 175% too high? Get the long-run average deficit down to 4%, and the debt-GDP ratio converges to 80%. Deficit of 3% of GDP, debt of 60% of GDP. (Yes, the Maastricht criteria apparently assume 5% growth in nominal GDP.) It is not at all clear what the criteria are for determining the best long-run debt-GDP ratio, but that’s what you’ve got to do before you can say whether the total deficit is too high — or too low.

One last point: An implication of that last equation above is that if the total deficit averages zero over a long period, the debt-GDP ratio will also converge to zero. In other words, “Balance the budget over the business cycle” is another way of saying, “Pay off the whole federal debt.” Yet I doubt many of the people who argue for the former, would support the latter. Which only shows how important it is to get the accounting relationships clear.

EDIT: I should stress: There is nothing original here. Any economist who does anything remotely related to public finance would read this and say, yes, yes, so what, of course — or at least I sure hope they would. But you really do have to be clear on these relationships for terms like “sustainable” to have any meaning.

For instance, let’s go back to that Peterson budget summit. As far as I can tell, five of the six organizations that submitted budget proposals used the CBO’s assumptions for growth and interest rates. (EPI tweaked them somewhat.) But given those assumptions, only two of the budgets — EPI  and AEI — actually stabilize the debt-GDP ratio. (Interestingly, they do so at about the same level — 70% of GDP for AEI, and 80% of GDP for EPI.) The other four budgets describe a path on which the entire federal debt is retired, and the federal government accumulates a net asset position that grows without limit relative to GDP. Personally, I am all for public ownership of the means of production. But I didn’t realize that’s what people had in mind when they called a budget “sustainable”. Of course, presumably that is, indeed, not what the people at CAP, Heritage, or the Roosevelt Campus Network had in mind; presumably they just didn’t think through the long-term implications of their budget numbers. Which is sort of the point of this post.

UPDATE: … and not 12 hours after I post this, here’s John Quiggin at Crooked Timber writing that the US needs “a substantial increase in tax revenue in the long term” and backing it up with the claim,”I assume [the optimal debt-GDP ratio is] finite, which would not be the case under plausible scenarios with no new revenue and maintenance of current discretionary expenditure relative to national income.” As we’ve seen , given the historic pattern where GDP growth is above the interest rate, this statement is simply false.

Of course, John Q. might be assuming this historic relationship will be reversed in the future. But then you could just as logically say that the interest rate is too high, or inflation is too low, as that higher taxes are needed. The view that it must be taxes that adjust implicitly assumes that that longer term interest rates aren’t responsive to policy, and that deliberately raising inflation can’t even be discussed. In other words, while surpluses later is often presented as part of an argument for deficits now, the case for surpluses in the future rests on premises that also largely rule out more aggressive monetary stimulus in the present.

The Beatings Will Continue…

This may be the answer to this.

Shorter DeLong:

It is perfectly obvious that the cause of the Great Recession was an insufficient supply of government debt. And it is perfectly obvious that we need to reduce the supply of government debt.

Let me spoil the joke by explaining it.

The argument that the collapse in demand for currently produced goods and services in 2007-2009 was due to an excess demand for AAA assets, i.e. government debt, is a useful one, as far as it goes. But the strange thing is that the New Keynesians making it don’t seem to think it conveys any information about the long-term fiscal position. Presumably, if we’d known about the coming excess demand for government debt, we’d have wanted higher deficits throughout the 2000s, instead of having to ramp them up suddenly at the end of the decade. And presumably, the circumstances that led to higher demand for government debt in 2007-2009 can be expected to recur. So maybe we want to prepare for them going forward? But no, we still need the debt-GDP ratio to be “sustainable” — a term which is never defined, except it’s always lower than where we are now. The fact that the ratio was too low, rather than too high, in the recent past somehow fails to imply that it could be too low, rather than too high, in the future.

Let me come at this another way. Check out the entrants in the Peterson Institute budget beauty contest. All of them are considered by the judges to have rocked the swimsuit competition “put the federal debt on a sustainable trajectory through 2035.” But what does this mean? The fiscal positions at the end date range from a surplus of 0.8% of GDP to a deficit of 3.7%. Debt-GDP ratios range from 30% to 81.7%. The highest-deficit entrant (EPI’s, for what it’s worth) is near the very high end of the historical range, and essentially identical to the CBO’s current-policy baseline. If current policy is sustainable, why are we having this conversation? But of course, Peterson gives no indication how “sustainable” is being defined (or for that matter what they’re assuming about GDP growth and the interest rate on government debt, quite important for these exercises).

Mainstream discourse on budget deficits (as with inflation) combines an absolute conviction that the current debt-GDP ratio is too high, with a complete lack of principles for telling us what the optimal ratio might be.

Bond Market Vigilantes: Invisible or Inconceivable?

Brad DeLong is annoyed with people who are scared of invisible bond-market vigilantes. And he’s right to be annoyed! It’s extraordinarily silly — or dishonest — to claim that the confidence of bondholders constrains fiscal policy in the United States. As he puts it, “Any loss of confidence in the long-term fiscal stability of the United States of America” is an “economic thing that does not exist.”

So he’s right. But does he have the right to be right?

I’m going to say No. Because the error he is pointing to, is one that the economics he teaches gives no help in avoiding.

The graduate macroeconomics course at Berkeley uses David Romer’s Advanced Macroeconomics, 3rd Edition. (The same text I used at UMass.) Here’s what it says about government budget constraints:

What this means is that the present value of government spending across all future time must be less than or equal to the present value of taxation across all future time, minus the current value of government debt. This is pretty much the starting point for all mainstream discussions of government budgets. In Blanchard and Fischer, another widely-used graduate macro textbook, the entire discussion of government budgets is just the working-out of that same equation. (Except they make it an equality rather than an inequality.) If you’ve studied economics at a graduate level, this is what government budget constraint means to you.

But here’s the thing: That kind of constraint has nothing to do with the kind of constraint DeLong’s post is talking about.

The textbook constraint is based on the idea that government is setting tax and spending levels for all periods once and for all. There’s no difference between past and future — the equation is unchanged if you reverse the sign of the t terms (i.e. flip the past and future) and simultaneously reverse the sign of the interest rate. (In the special case where the interest rate is zero, you can put the periods in any order you like.) This approach isn’t specific to government budget constraints, it’s the way everything is approached in contemporary macroeconomics. The starting point of the Blanchard and Fischer book, like many macro textbooks, is the Ramsey  model of a household (central planner) allocating known production and consumption possibilities across an infinite time horizon. (The Romer book starts with the Solow growth model and derives it from the Ramsey model in chapter two.) Economic growth simply means that the parameters are such that the household, or planner, chooses a path of output with higher values in later periods than in earlier ones. Financial markets and aggregate demand aren’t completely ignored, of course, but they’re treated as details to be saved for the final chapters, not part of the main structure.

You may think that’s a silly way to think about the economy (I may agree), but one important feature of these models is that the interest rate is not the cost of credit or finance; rather, it’s the fixed marginal rate of substitution of spending or taxing between different periods. By contrast, that interest is the cost of money, not the cost of substitution between the future and the present, was maybe the most important single point in Keynes’ General Theory. But it’s completely missing from contemporary textbooks, even though it’s only under this sense of interest that there’s even the possibility of bond market vigilantism. When we are talking about the state of confidence in the bond market, we are talking about a finance constraint — the cost of money — not a budget constraint. But the whole logic of contemporary macroeconomics (intertemporal allocation of real goods as the fundamental structure, with finance coming in only as an afterthought) excludes the possibility of government financing constraints. At no point in either Romer or Blanchard and Fischer are they ever discussed.

You can’t expect people to have a clear sense of when government financing constraints do and don’t bind, if you teach them a theory in which they don’t exist.

EDIT: Let me spell the argument out a little more. In conventional economics, time is just another dimension on which goods vary. Jam today, jam tomorrow, jam next week are treated just like strawberry jam, elderberry jam, ginger-zucchini jam, etc. Either way, you’re choosing the highest-utility basket that lies within your budget constraint. An alternative point of view – Post Keynesian if you like – is that we can’t make choices today about future periods. (Fundamental uncertainty is one way of motivating this, but not the only way.) The tradeoff facing us is not between jam today and jam tomorrow, but between jam today and money today. Money today presumably translates into jam tomorrow, but not on sufficiently definite terms that we can put it into the equations. (It’s in this sense that a monetary theory and a theory of intertemporal optimization are strict alternatives.) Once you take this point of view, it’s perfectly logical to think of the government budget constraint as a financing constraint, i.e. as the terms on which expenditure today trades off with net financial claims today. Which is to say, you’re now in the discursive universe where things like bond markets exist. Again, yes, modern macro textbooks do eventually introduce bond markets — but only after hundreds of pages of intertemporal optimization. If I wrote the textbooks, the first model wouldn’t be of goods today vs. goods tomorrow, but goods today vs. money today. DeLong presumably disagrees. But in that world, macroeconomic policy discussions might annoy him less.

What’s Good Enough for GE Is Good Enough for America

[Originally posted at New Deal 2.0.]

S&P’s threat to downgrade the US government’s credit rating has been dismissed by economist-bloggers as a political intervention by bondowners and compared to “adorable children wearing their underpants outside their trousers.” As far as the chances of the US someday defaulting on its debt go, the announcement has zero informational value.

Still, it’s true that federal debt held by the public has reached 60 percent of GDP, while tax revenues remain around 20 percent of GDP. 60 percent of GDP is a lot! And double, nearly triple, tax revenue! What would we call a company with outstanding debt double or even triple its revenues, and expected to keep the highest bond rating?

We could call it General Electric. 

As recently as 2007, GE had an S&P rating of AAA with outstanding debt at over three time revenues. Or we could call it the Tennessee Valley Authority; TVA managed outstanding debt of 3.9 times revenue in the late ’90s (it’s since come down a bit), and S&P never downgraded its bond rating from AAA. Or, we could call it Hydro Quebec, with debt of over 4.5 times revenues (altho, admittedly, its S&P rating is only A+). Or the natural gas and energy supplier TransCanada, with debt equal to 2.2 time revenues and an A rating from S&P. Even Transocean, which operated the Deepwater Horizon rig for BP, managed an A- rating prior to the spill, with a debt-revenue ratio similar to what the federal government has now.

Now, it’s perfectly sensible for a big utility, with its high proportion of long-lived fixed capital and stable revenue streams, to carry a lot of debt. If I ran Hydro Quebec (and converting the company to a worker- and consumer-owned cooperative wasn’t an option), I’d take on a lot of debt too. But here’s the point. If the question is, what if the government had to fund itself like a private business, the answer isn’t necessarily that it would do anything different from what it’s doing now.

In the real world, of course, there are lots of differences between the government of the United States and a private business. The federal government issues the currency that its debt is denominated in. It has effectively unlimited authority to increase taxes on the private sector. And its liabilities are the most important store of value and means of payment for the private sector. (When Alan Greenspan said that the financial system would have a real problem without holdings of federal debt, he may have been arguing in bad faith, but he wasn’t wrong.) And of course, the US government is responsible for output and employment in the economy as a whole, and not just for its own balance sheet. All these differences mean that it makes sense for the US government to carry more debt than a private business. If GE or Transocean are safe bets for lenders with debt of two or three times revenue, then the federal government must be ultra ultra safe. Which, interestingly enough, is just what the bond market says.

So perhaps we can get away from the “oooh, that’s a really big number!” school of analysis of federal borrowing. And instead ask what levels of federal deficit and outstanding debt are most compatible with economic growth and financial stability. For the foreseeable future, I’d suggest, the answer has a lot more to do with the role of government spending in aggregate demand, and with government debt as a risk-free asset for the private sector, than with the level of debt that’s “sustainable”. Because if you think there are more states of the world where TVA or GE make their payments to bondholders than where the US government does, you must be smoking something from S&P’s private stash.

UPDATE: This excellent post from Mike Konczal makes the same point more systematically.